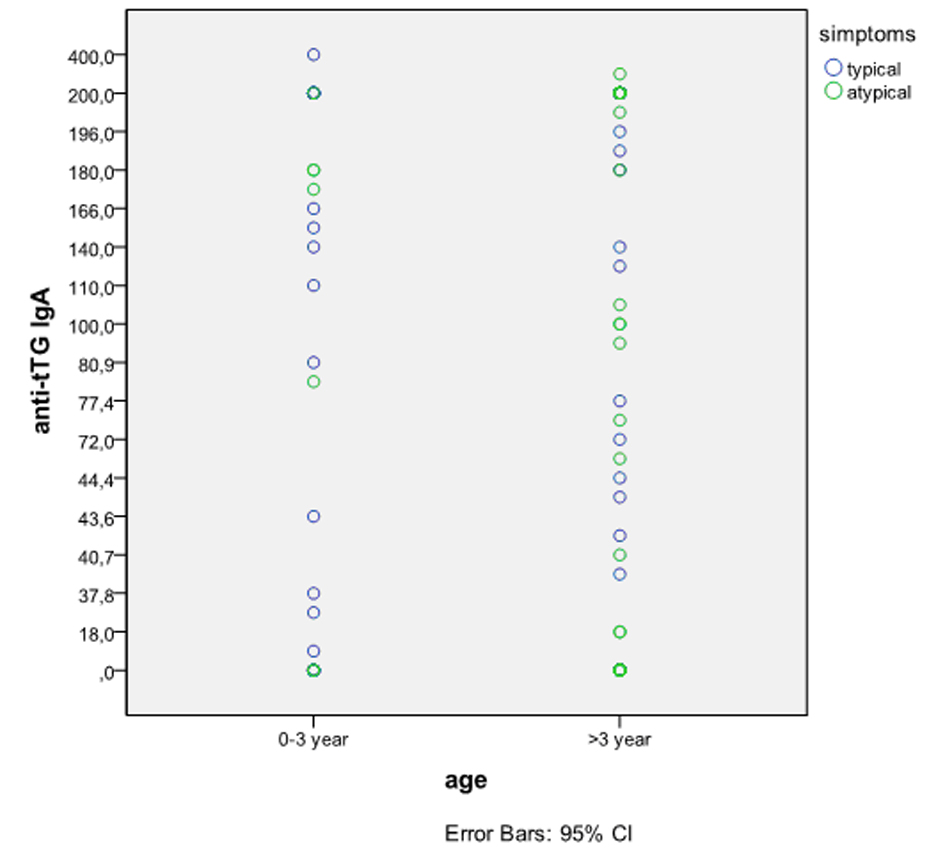
Figure 1. Serum tTG antibody level vs patient age. There was no age-related differences in tTG antibody titers. Pearson Chi-Square 0.242, P = 7.96.
| International Journal of Clinical Pediatrics, ISSN 1927-1255 print, 1927-1263 online, Open Access |
| Article copyright, the authors; Journal compilation copyright, Int J Clin Pediatr and Elmer Press Inc |
| Journal website http://www.theijcp.org |
Original Article
Volume 1, Number 4-5, October 2012, pages 109-114
Pediatric Typical Vs. Atypical Celiac Disease: Correlation of Duodenal Histology With Tissue Transglutaminase Levels
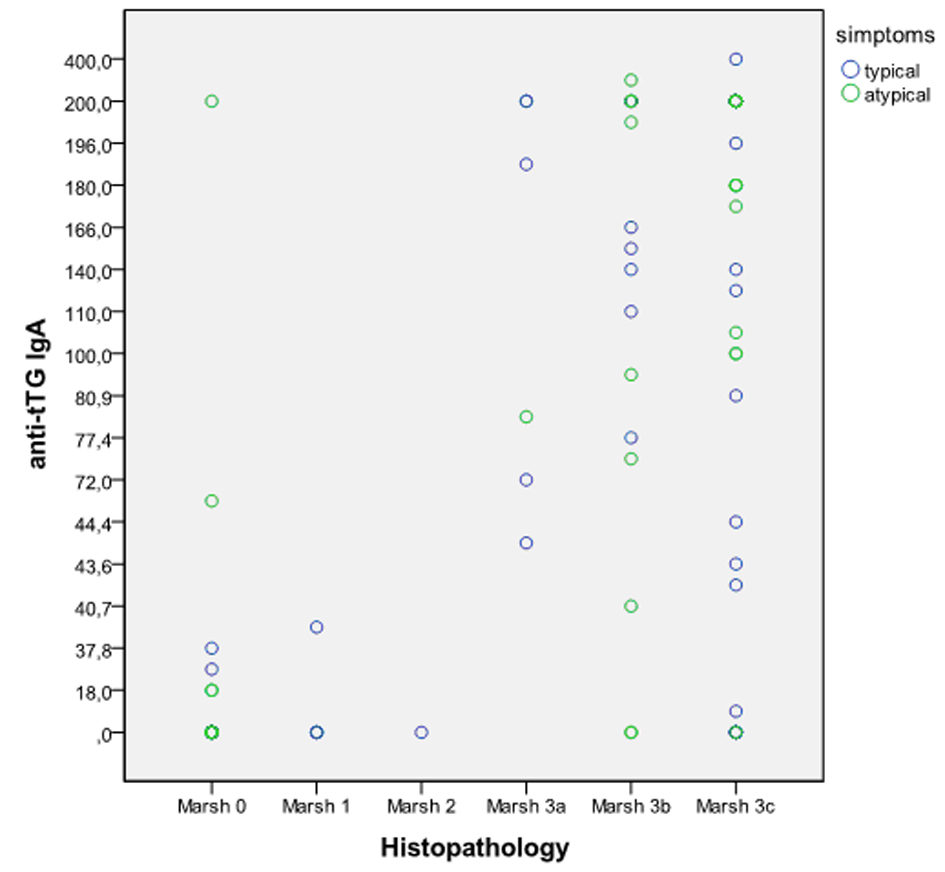
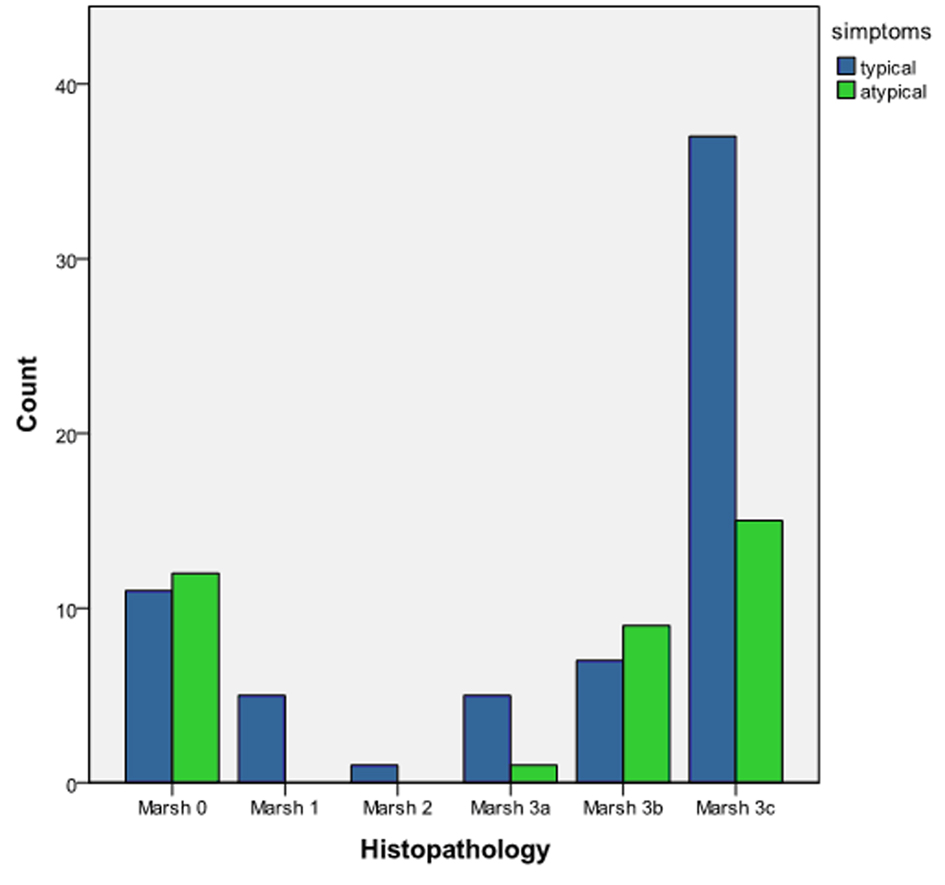
Figures