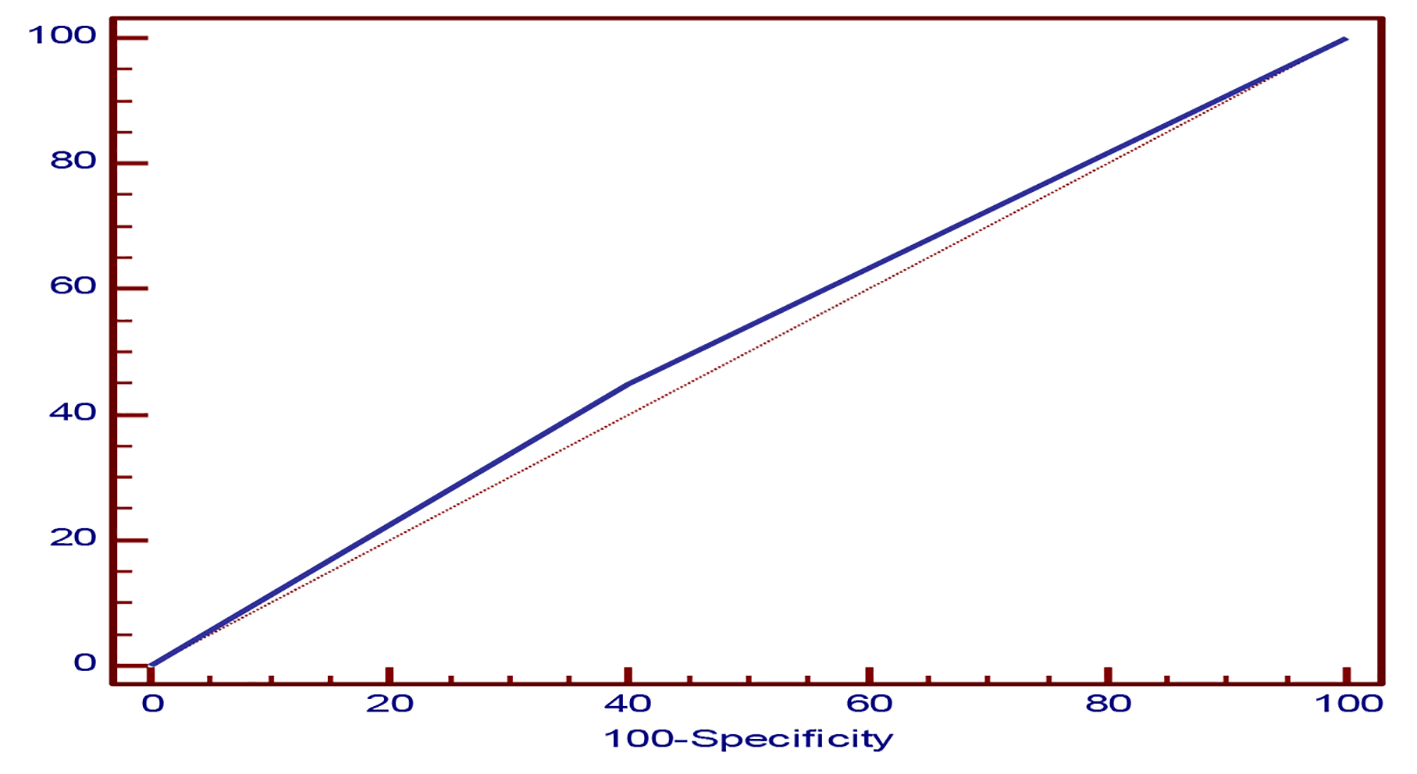
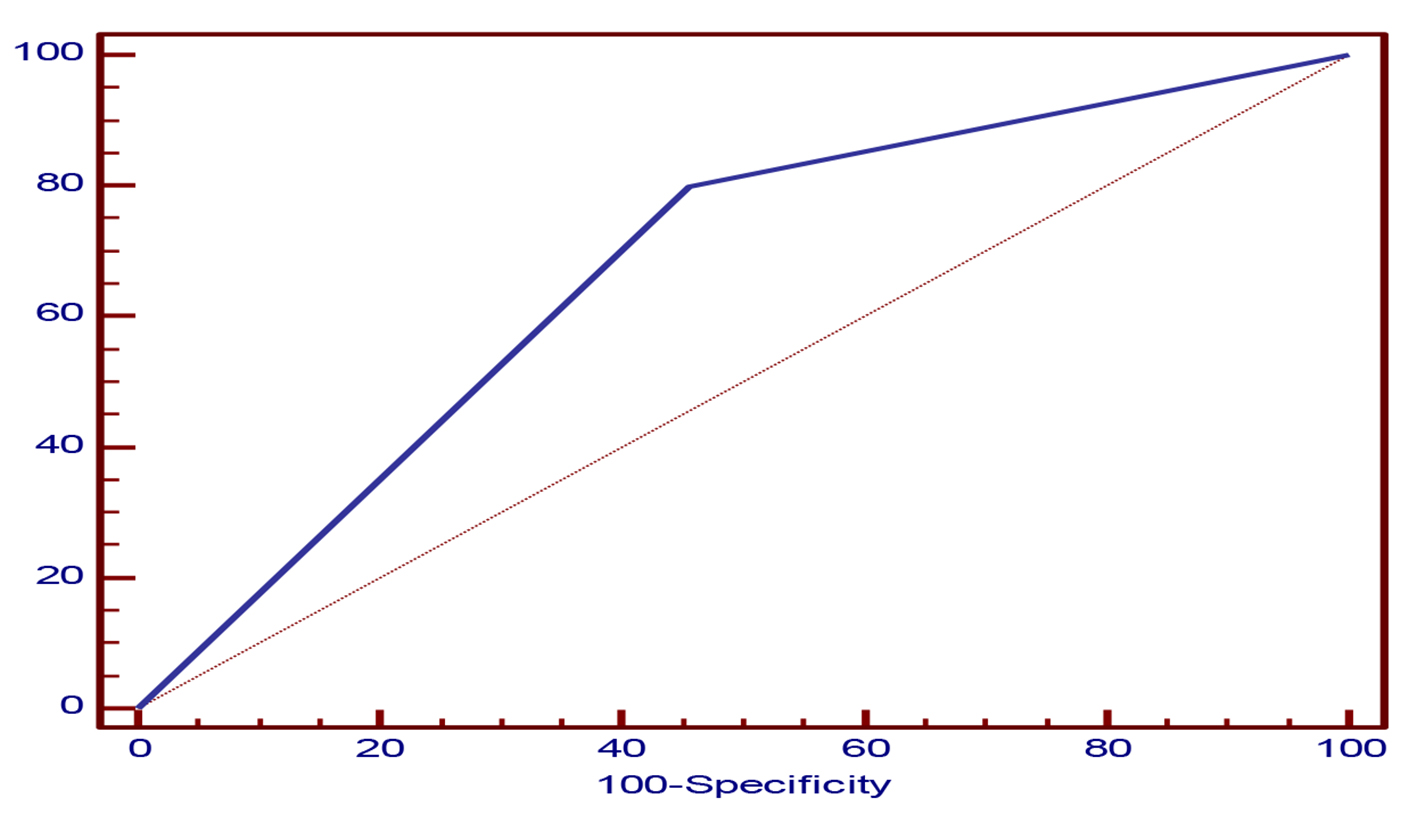
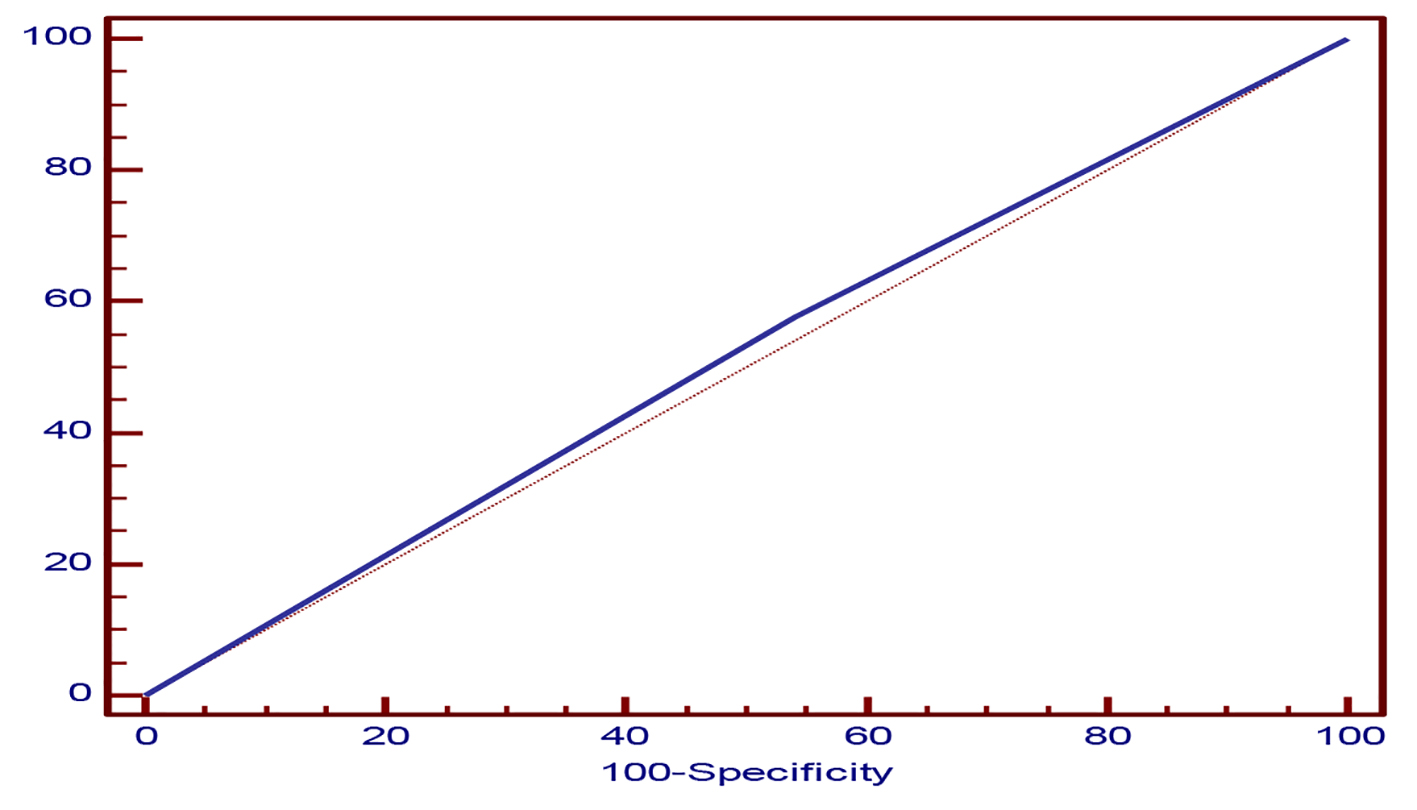
Figure 1. Curve shows the sensitivity and specificity of EEG.
| International Journal of Clinical Pediatrics, ISSN 1927-1255 print, 1927-1263 online, Open Access |
| Article copyright, the authors; Journal compilation copyright, Int J Clin Pediatr and Elmer Press Inc |
| Journal website http://www.theijcp.org |
Original Article
Volume 6, Number 1-2, June 2017, pages 1-7
Clinical and Laboratory Characteristics of Herpes Simplex Encephalitis in Children in Qena Governorate, Egypt
Figures
Tables
| Demographic data | N = 50 | % |
|---|---|---|
| Age | ||
| < 1 year | 23 | 46.0 |
| 1 - 5 years | 17 | 34.0 |
| > 5 years | 10 | 20.0 |
| Sex | ||
| Male | 29 | 58.0 |
| Female | 21 | 42.0 |
| Residence | ||
| Urban | 19 | 38.0 |
| Rural | 31 | 62.0 |
| Socioeconomic status | ||
| Low | 20 | 40.0 |
| Middle | 17 | 34.0 |
| High | 13 | 26.0 |
| N = 50 | % | |
|---|---|---|
| Lethargy | 9 | 18.0 |
| Behavioral changes | 16 | 32.0 |
| Seizure | 30 | 60.0 |
| Neck stiffness | 21 | 42.0 |
| Focal neurological finding | 23 | 46.0 |
| GCS < 10 | 26 | 52.0 |
| PCR | No. of total cases (50) | ||||
|---|---|---|---|---|---|
| Positive (N = 28) | Negative (N = 22) | ||||
| No. | % | No. | % | ||
| Age (years) | |||||
| < 1 | 12 | 52.2 | 11 | 47.8 | 23 |
| 1 - 5 | 10 | 58.8 | 7 | 41.2 | 17 |
| > 5 | 6 | 60.0 | 4 | 40.0 | 10 |
| P-value | NS | ||||
| Sex | |||||
| Male | 11 | 37.9 | 18 | 62.1 | 29 |
| Female | 17 | 81.0 | 4 | 19.0 | 21 |
| P-value | < 0.05* | ||||
| Residence | |||||
| Urban | 9 | 47.4 | 10 | 52.6 | 19 |
| Rural | 19 | 61.3 | 12 | 38.7 | 31 |
| P-value | NS | ||||
| Socioeconomic state | |||||
| Low | 11 | 55.0 | 9 | 45.0 | 20 |
| Middle | 9 | 52.9 | 8 | 47.1 | 17 |
| High | 8 | 61.5 | 5 | 38.5 | 13 |
| P-value | NS | ||||
| Neuroimaging findings | PCR | No. of total cases (50) | |||
|---|---|---|---|---|---|
| Positive (N = 28) | Negative (N = 22) | ||||
| No. | % | No. | % | ||
| CT | |||||
| Abnormal findings* | 12 | 80.0 | 3 | 20.0 | 15 |
| Normal | 16 | 45.7 | 19 | 54.3 | 35 |
| P-value | < 0.05* | ||||
| EEG | |||||
| Abnormal findings* | 22 | 55.0 | 18 | 45.0 | 40 |
| Normal | 6 | 60.0 | 4 | 40.0 | 10 |
| P-value | NS | ||||
| GCS < 10 | EEG | CT | |
|---|---|---|---|
| Sensitivity | 57.69% | 45.0% | 80.0% |
| Specificity | 45.83% | 60.0% | 54.29% |
| Positive predictive value | 53.6% | 81.8% | 42.9% |
| Negative predictive value | 50.0% | 21.4% | 86.4% |
| Area under curve (AUC) | 0.518 | 0.525 | 0.671 |