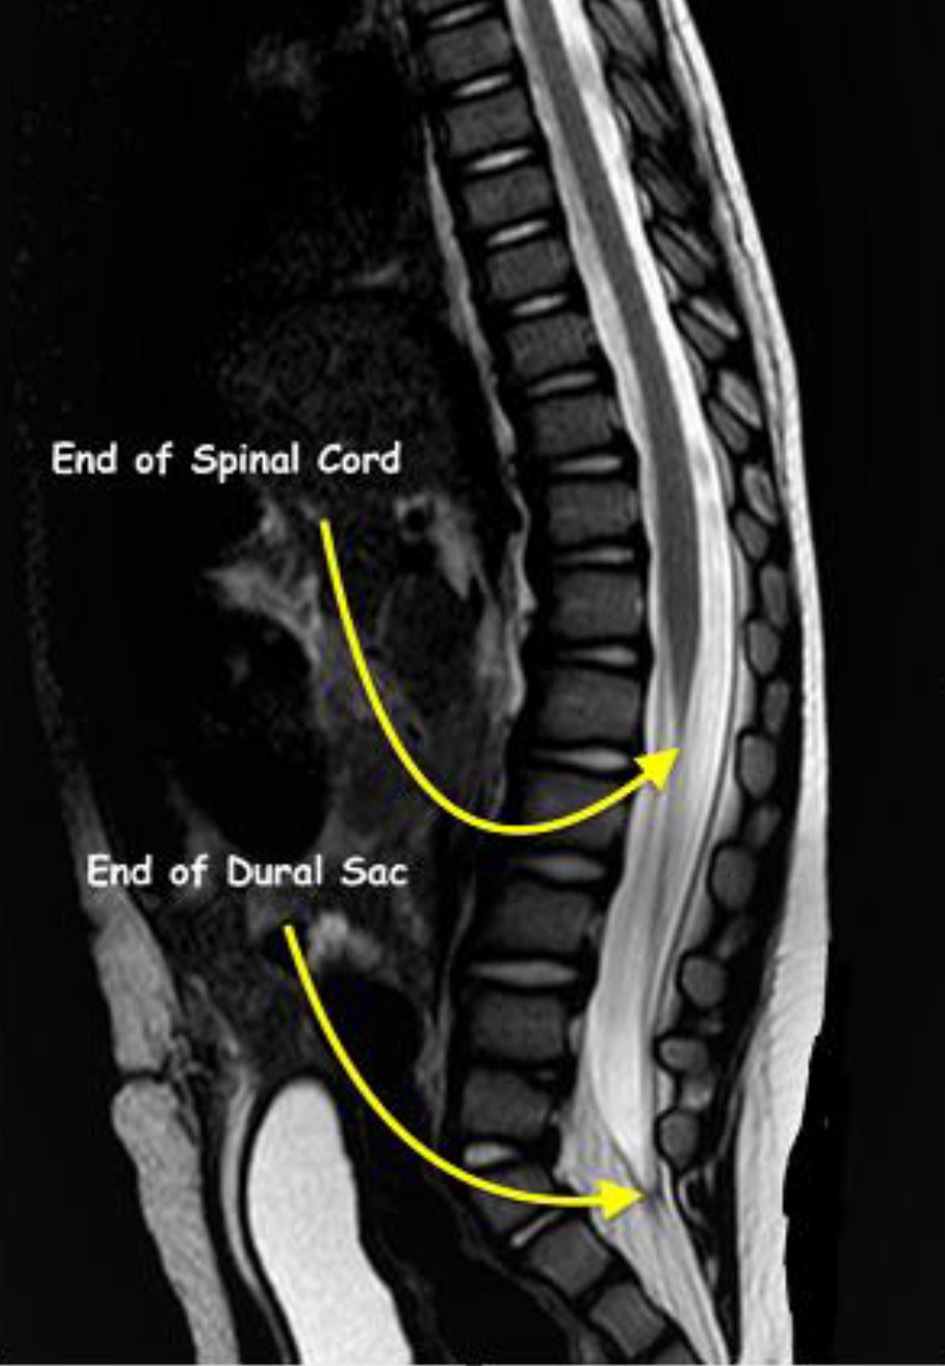
Figure 1. Magnetic resonance imaging showing termination of the spinal cord at L1 and the dural sac at S2 in a 1-year-old patient from the study cohort.
| International Journal of Clinical Pediatrics, ISSN 1927-1255 print, 1927-1263 online, Open Access |
| Article copyright, the authors; Journal compilation copyright, Int J Clin Pediatr and Elmer Press Inc |
| Journal website https://www.theijcp.org |
Original Article
Volume 11, Number 1, March 2022, pages 2-8
Magnetic Resonance Imaging of the Caudal Epidural Space: Implications for the Clinical Practice Regional Anesthesia in Infants and Children
Figures
Tables
| Variables | All (n = 91) | Male (n = 47) | Female (n = 44) | P-value |
|---|---|---|---|---|
| Distance is listed in millimeters (mm). The data are presented as the mean (standard deviation). BSA: body surface area. | ||||
| Age (months) | 45.5 (29.3) | 47.0 (28.8) | 44.0 (30.1) | 0.633 |
| Height (cm) | 95.2 (25.6) | 96.8 (24.4) | 93.5 (26.9) | 0.543 |
| Weight (kg) | 16.7 (8.1) | 17.0 (7.0) | 16.3 (9.2) | 0.684 |
| BSA (m2) | 0.66 (0.24) | 0.67(0.21) | 0.64 (0.26) | 0.629 |
| Spinal cord to dural sac (mm) | 90.2 (23.7) | 92.5 (21.8) | 87.7 (25.6) | 0.335 |
| Spinal cord to sacral hiatus (mm) | 109.0 (28.1) | 111.1 (25.4) | 106.7 (30.8) | 0.45 |
| Spinal cord to skin (mm) | 112.3 (28.0) | 113.7 (3.7) | 110.8 (30.8) | 0.624 |
| Dural sac to sacral hiatus (mm) | 23.9 (7.2) | 23.9 (6.3) | 23.8 (8.2) | 0.935 |
| Dural sac to skin (mm) | 33.3 (9.9) | 31.6 (7.9) | 35.1 (11.4) | 0.092 |
| Distances (mm) | < 6 months (n = 8) | > 6 to < 12 months (n = 7) | > 12 to < 18 months (n = 9) | > 18 to < 24 months (n = 8) | > 24 to < 36 months (n = 7) | > 36 to < 48 months (n = 6) | > 48 to < 60 months (n = 12) | > 60 to < 72 months (n = 9) | > 72 to < 84 months (n = 18) | > 84 months (n = 7) |
|---|---|---|---|---|---|---|---|---|---|---|
| Distances are shown in millimeters. Q1: first quartile; Q3: third quartile; IQR: interquartile range. | ||||||||||
| Spinal cord to dural sac | ||||||||||
| Median | 52.5 | 54.8 | 76.4 | 76.8 | 78.7 | 90.4 | 96.8 | 112.4 | 112.6 | 114.9 |
| IQR (Q1, Q3) | 39.7, 55.7 | 53.9, 69.5 | 63.8, 85.3 | 76.1, 82.3 | 76, 84.9 | 84.9, 91.1 | 92.1, 108.7 | 95.9, 120.1 | 109, 120.2 | 110.4, 121.8 |
| Spinal cord to sacral hiatus (sacrococcygeal membrane) | ||||||||||
| Median | 60.5 | 67.6 | 92.5 | 93.5 | 93.1 | 110.7 | 117.2 | 130.6 | 137.2 | 135.4 |
| IQR (Q1, Q3) | 53.6, 64.2 | 65.8, 81.9 | 71.4, 99.9 | 89.3, 98.5 | 90.9, 95.8 | 107.2, 111.3 | 113.3, 124.4 | 121.4, 133.1 | 129.5, 144.2 | 135, 146.7 |
| Spinal cord to skin | ||||||||||
| Median | 63.3 | 74.6 | 94.3 | 99.8 | 98.3 | 113 | 121.3 | 133.9 | 141 | 142.8 |
| IQR (Q1, Q3) | 56.1, 68.4 | 70.4, 84.9 | 74.3, 102.1 | 94.9, 100.5 | 93.4, 100.5 | 108.6, 113.3 | 115.4, 128.9 | 124.7, 135.2 | 131.7, 150.1 | 138.4, 148.9 |
| Dural sac to sacral hiatus (sacrococcygeal membrane) | ||||||||||
| Median | 13.5 | 16.6 | 16.8 | 21.1 | 20.8 | 25 | 25.5 | 26.3 | 31.6 | 28.2 |
| IQR (Q1,Q3) | 12.2, 14.6 | 14.3, 17.9 | 15.1, 18.2 | 19.2, 22.6 | 20.5, 22.6 | 21.5, 27.9 | 22.7, 26.9 | 23.9, 29.4 | 27.8, 35.7 | 27.1, 35 |
| Dural sac to skin | ||||||||||
| Median | 20.7 | 25.2 | 25.8 | 32.2 | 29.4 | 32.3 | 32 | 35.4 | 40.2 | 41.4 |
| IQR (Q1, Q3) | 19.8, 23.5 | 22.1, 34.4 | 23.4, 29.3 | 27.6, 36.2 | 27.1, 33.5 | 25.1, 36.3 | 30.7, 35.4 | 30.1, 40.6 | 35.5, 47.9 | 37.6, 45.9 |
| Spinal cord to dural sac | Spinal cord to sacral hiatus | Spinal cord to skin | Dural sac to sacral hiatus | Dural sac to skin | |||||||||||
|---|---|---|---|---|---|---|---|---|---|---|---|---|---|---|---|
| β ± SE | P | R2 | β ± SE | P | R2 | β ± SE | P | R2 | β ± SE | P | R2 | β ± SE | P | R2 | |
| BSA: body surface area; VIF: variance inflation factor; SE: standard error. | |||||||||||||||
| Univariate model | |||||||||||||||
| Age (years) | 0.71 ± 0.04 | < 0.001 | 0.77 | 0.87 ± 0.04 | < 0.001 | 0.83 | 0.87 ± 0.04 | < 0.001 | 0.83 | 0.20 ± 0.01 | < 0.001 | 0.68 | 0.22 ± 0.03 | < 0.001 | 0.44 |
| BSA (m2) | 81.74 ± 6.11 | < 0.001 | 0.67 | 97.53 ± 7.11 | < 0.001 | 0.68 | 98.73 ± 6.89 | < 0.001 | 0.7 | 22.58 ± 2.17 | < 0.001 | 0.55 | 27.63 ± 3.29 | < 0.001 | 0.44 |
| Multivariate model | |||||||||||||||
| Age | 0.52 ± 0.07 | < 0.001 | 0.79 | 0.73 ± 0.08 | < 0.001 | 0.84 | 0.68 ± 0.08 | < 0.001 | 0.84 | 0.17 ± 0.03 | < 0.001 | 0.69 | 0.12 ± 0.05 | 0.014 | 0.48 |
| BSA | 26.50 ± 9.18 | 0.005 | 22.97 ± 9.54 | 0.018 | 27.57 ± 9.4 | 0.004 | 4.71 ± 3.4 | 0.17 | 14.88 ± 9.0 | 0.015 | |||||
| VIF (age, BSA) | 3.51 | ||||||||||||||