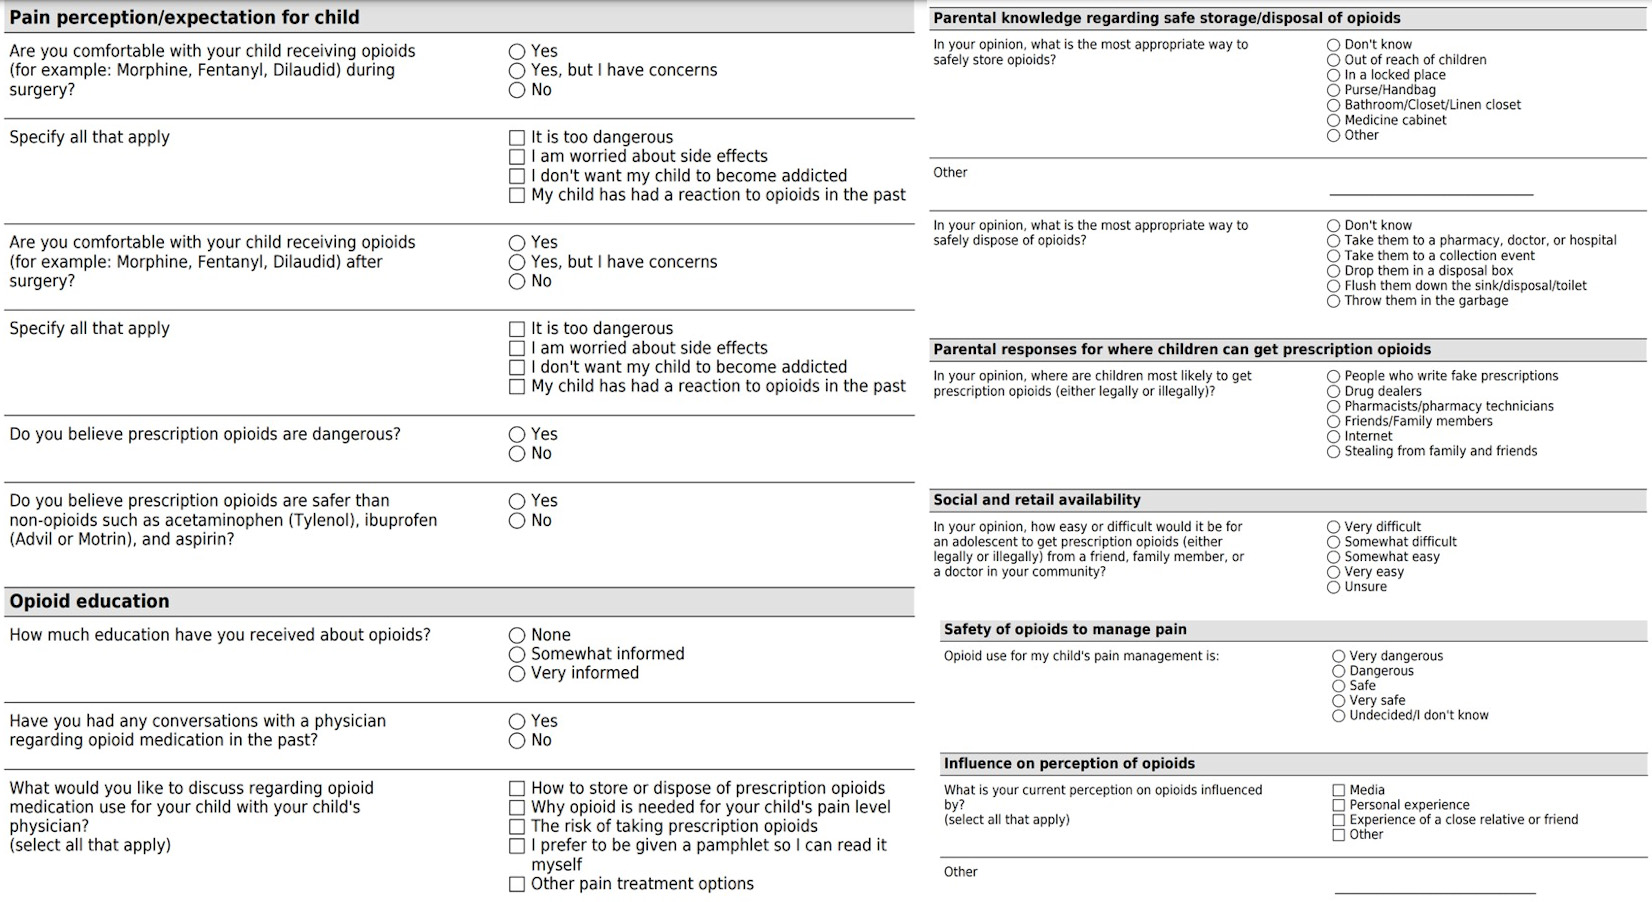
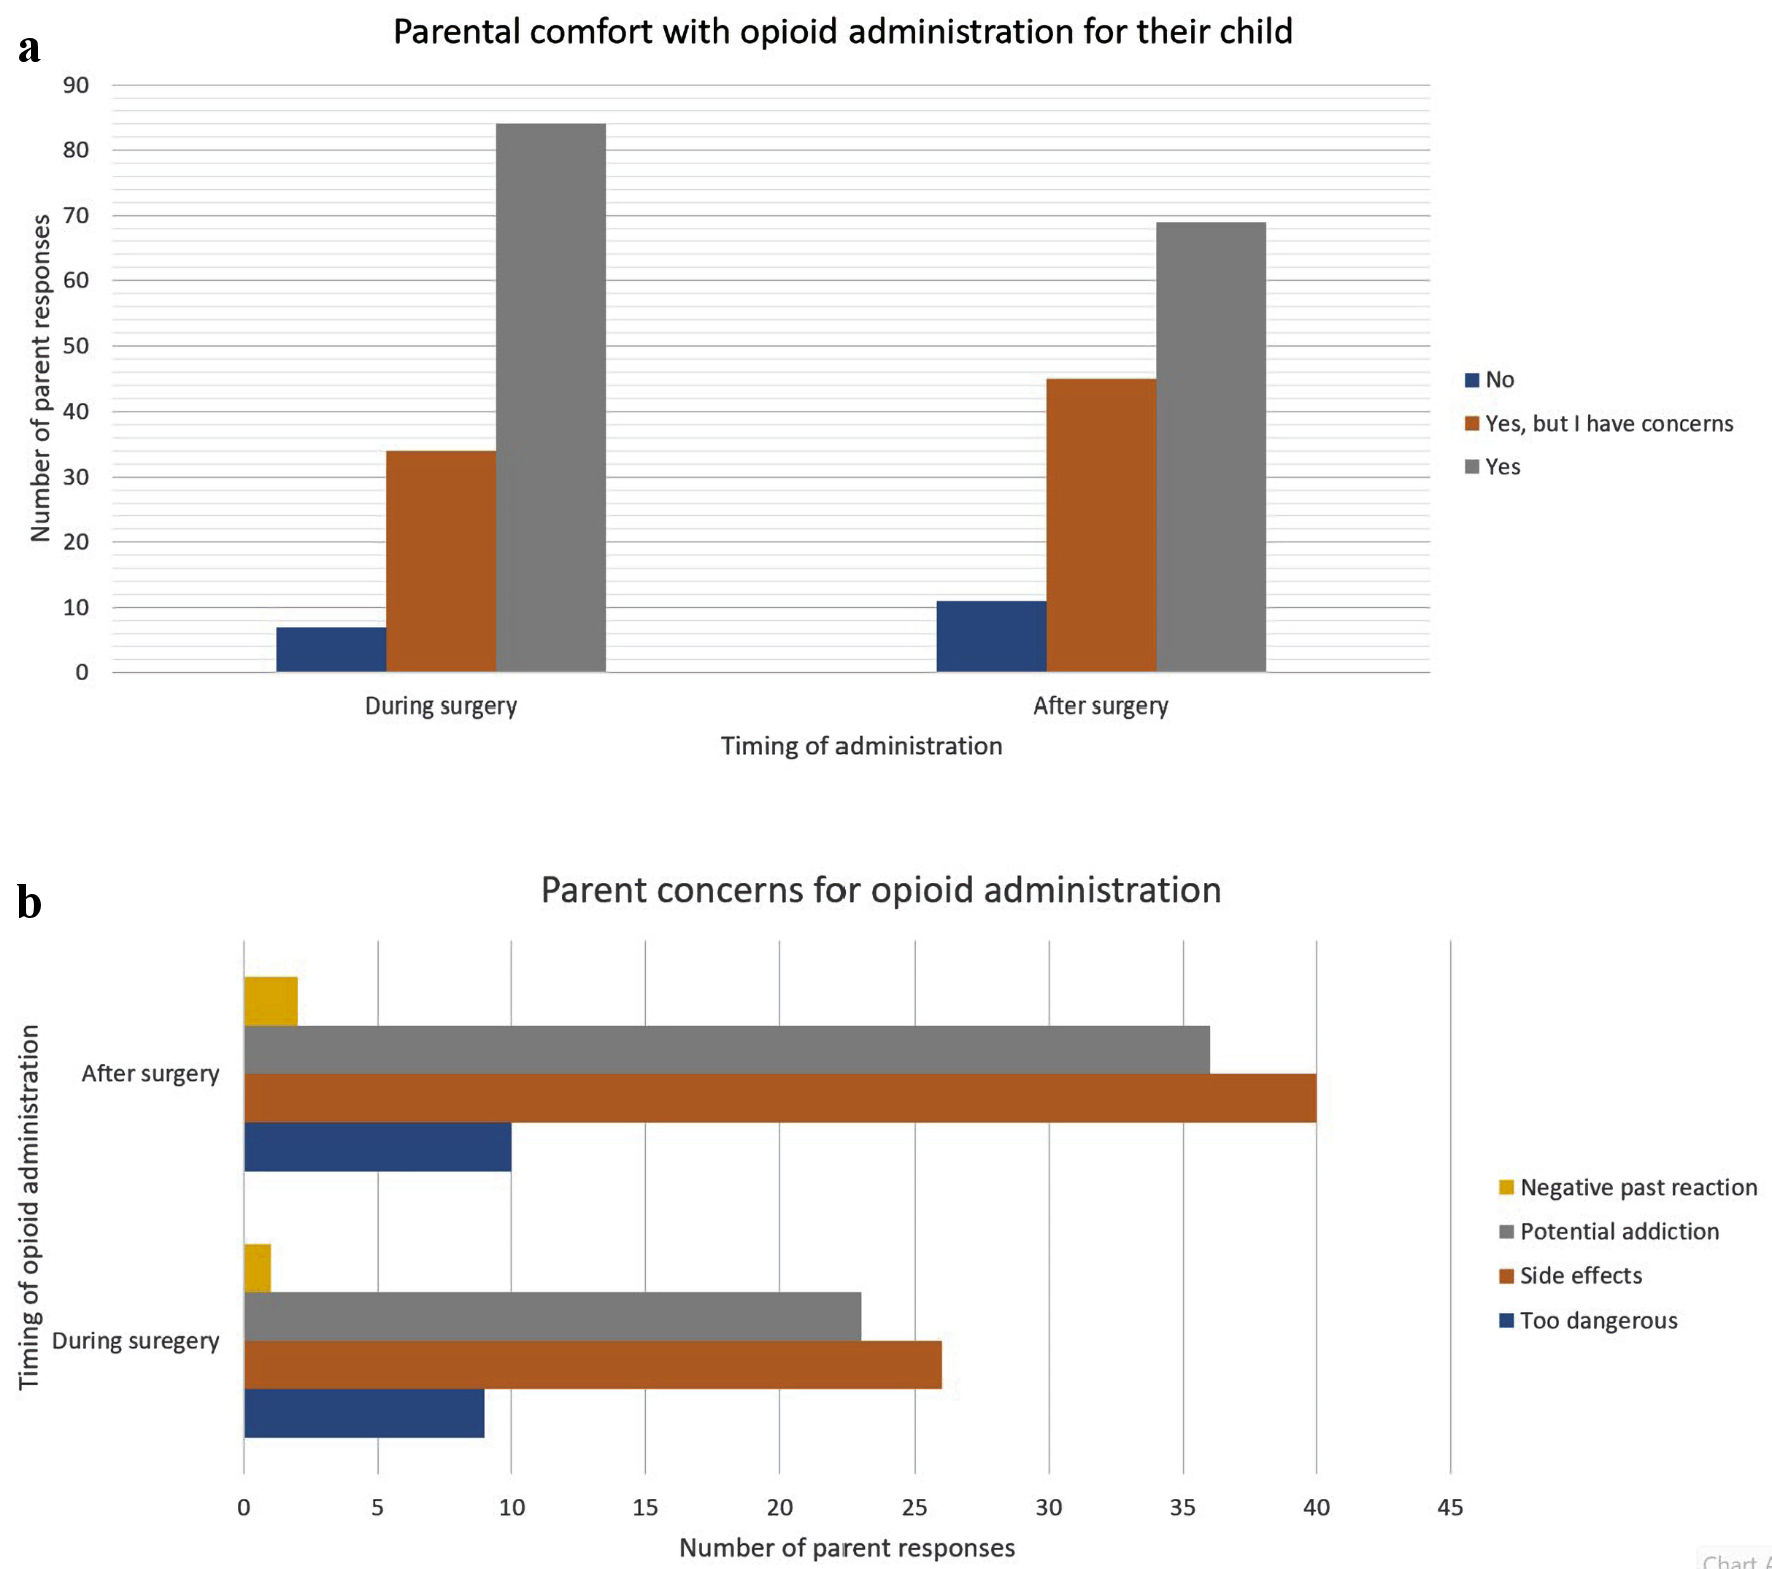
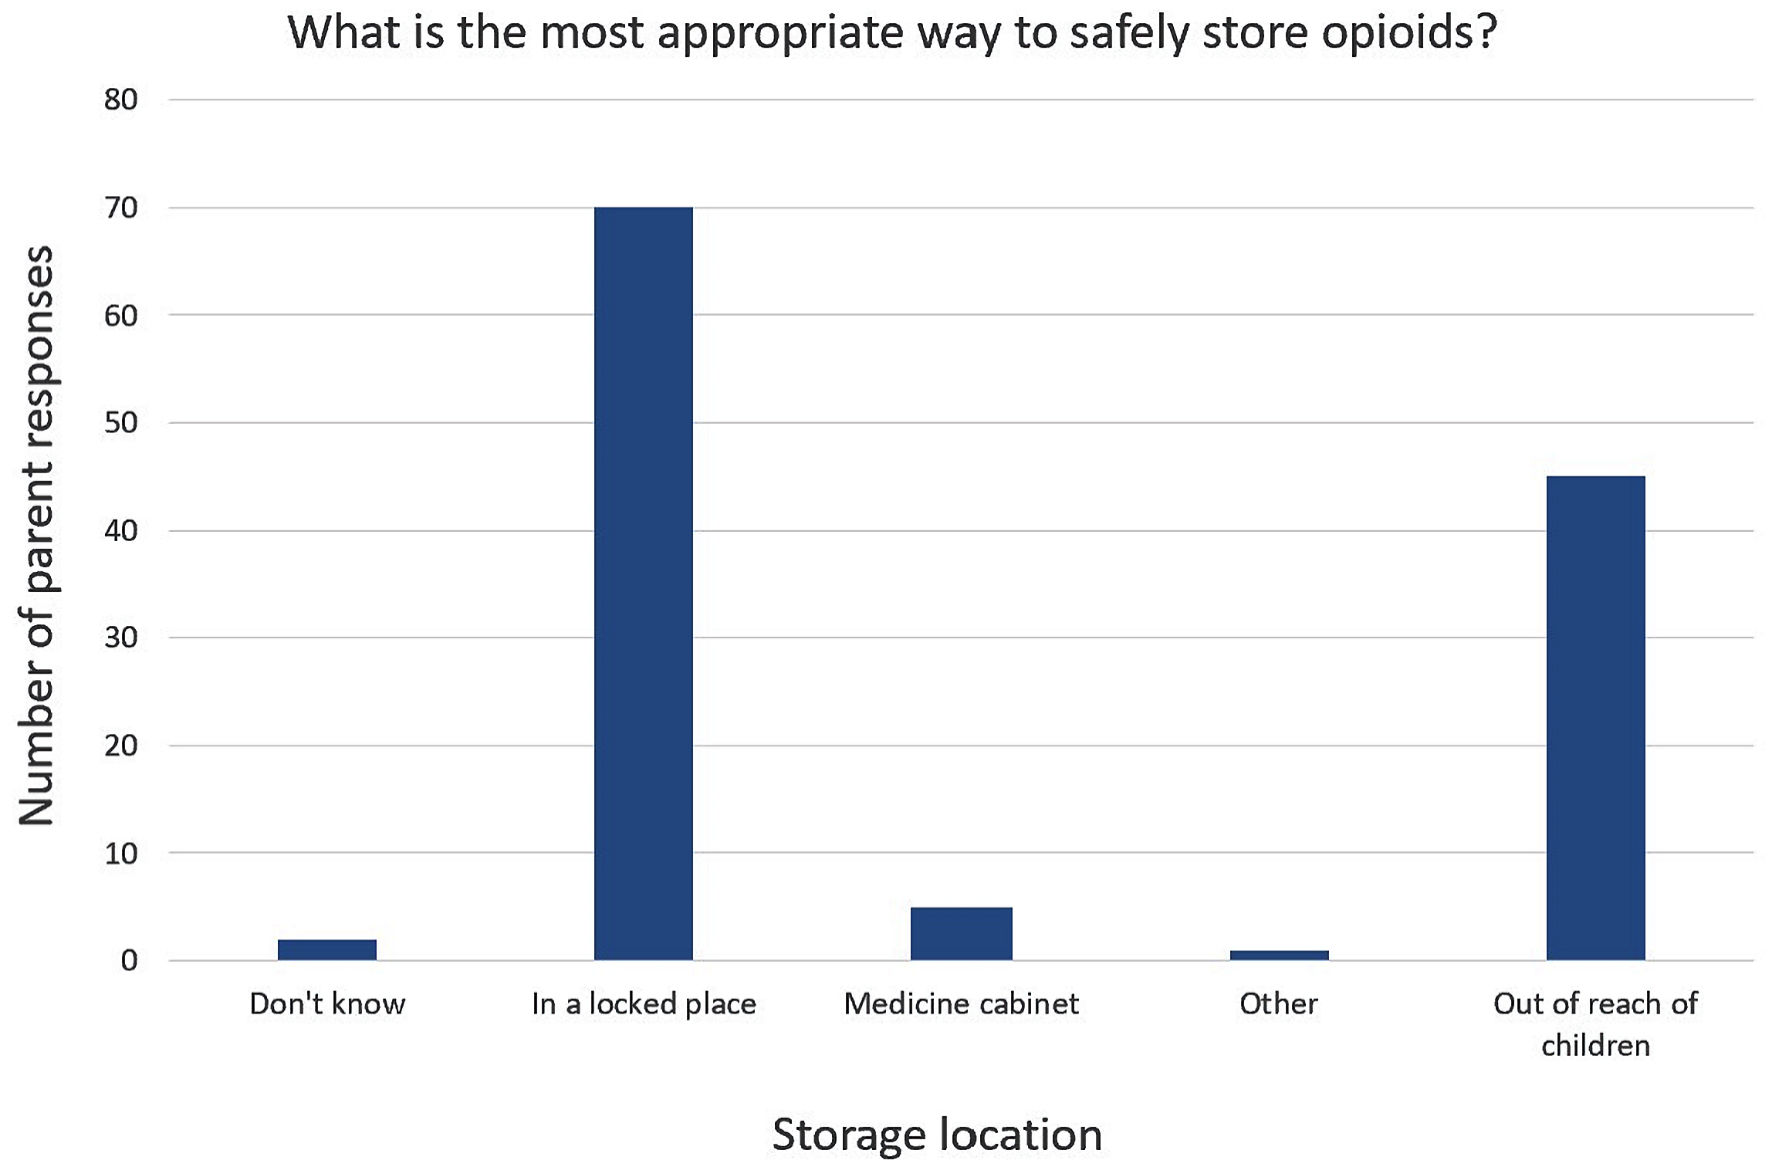
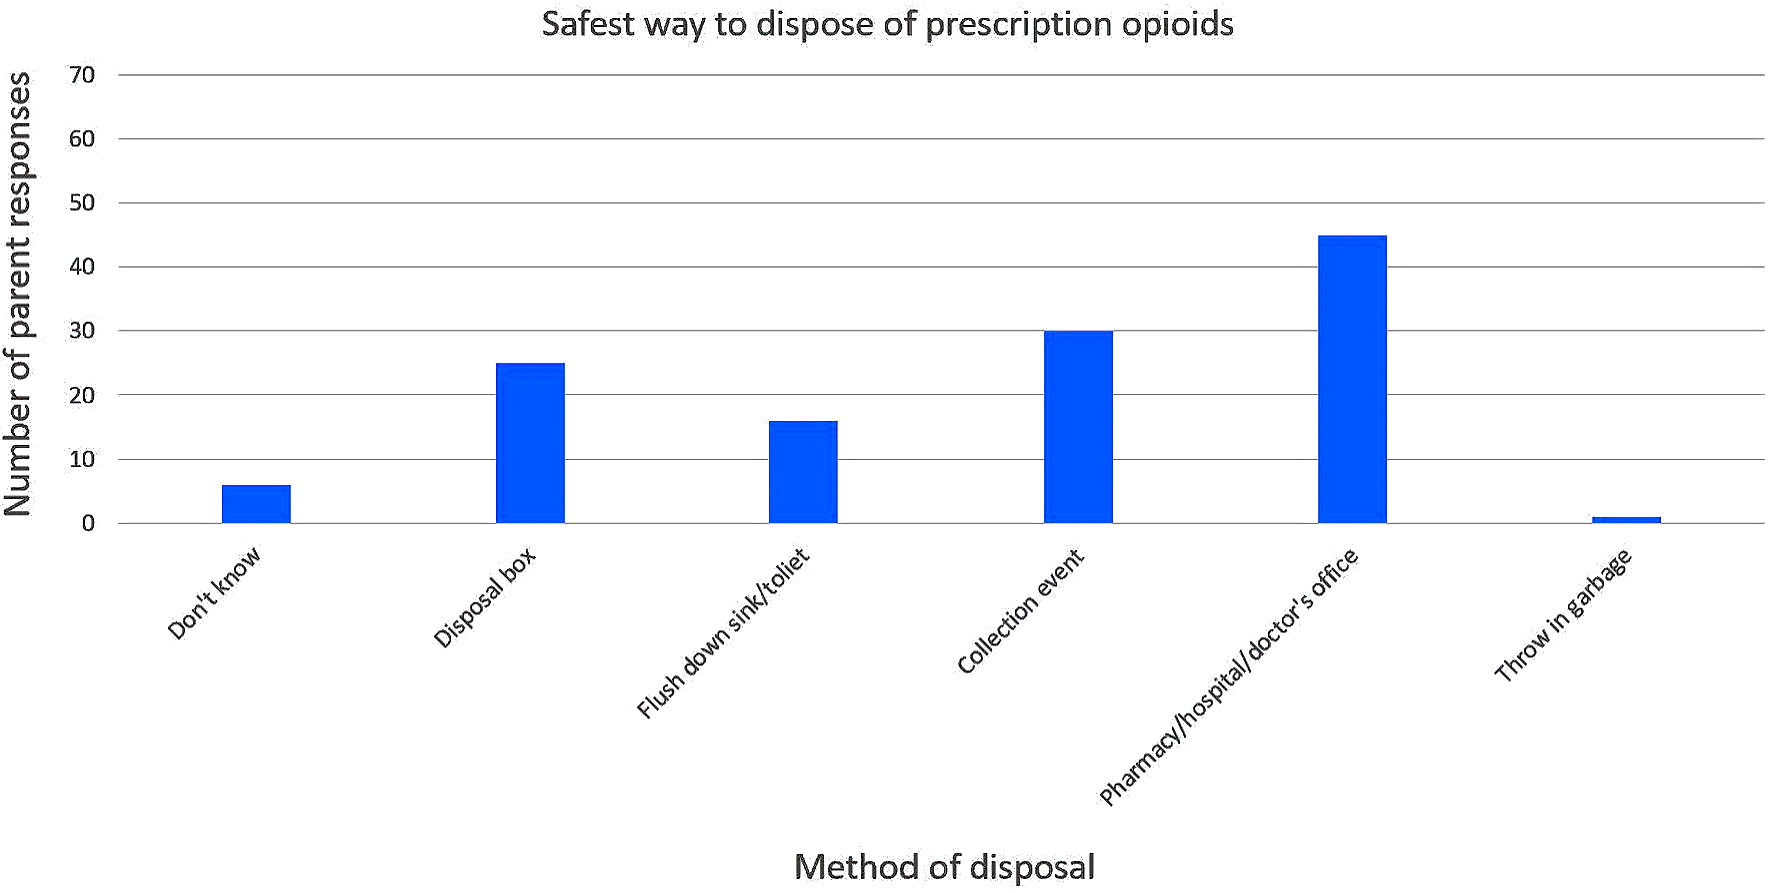
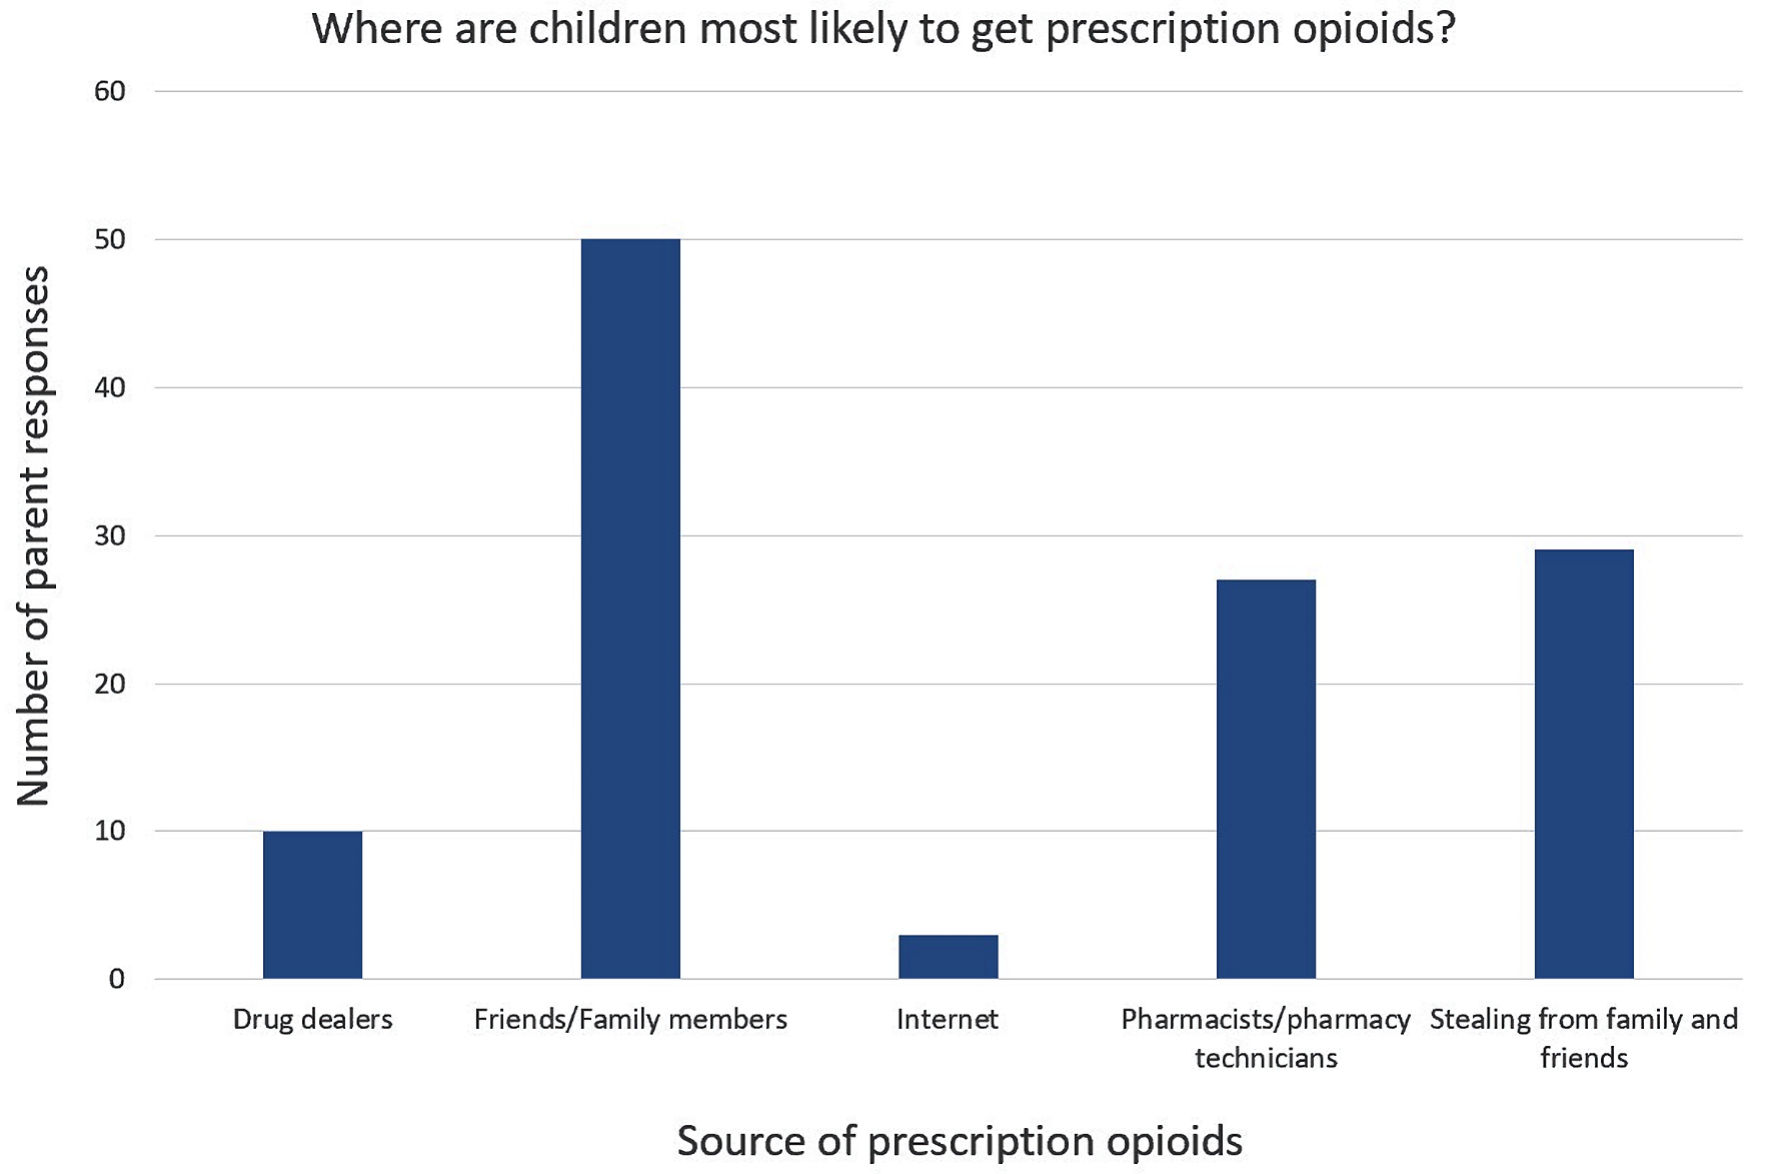
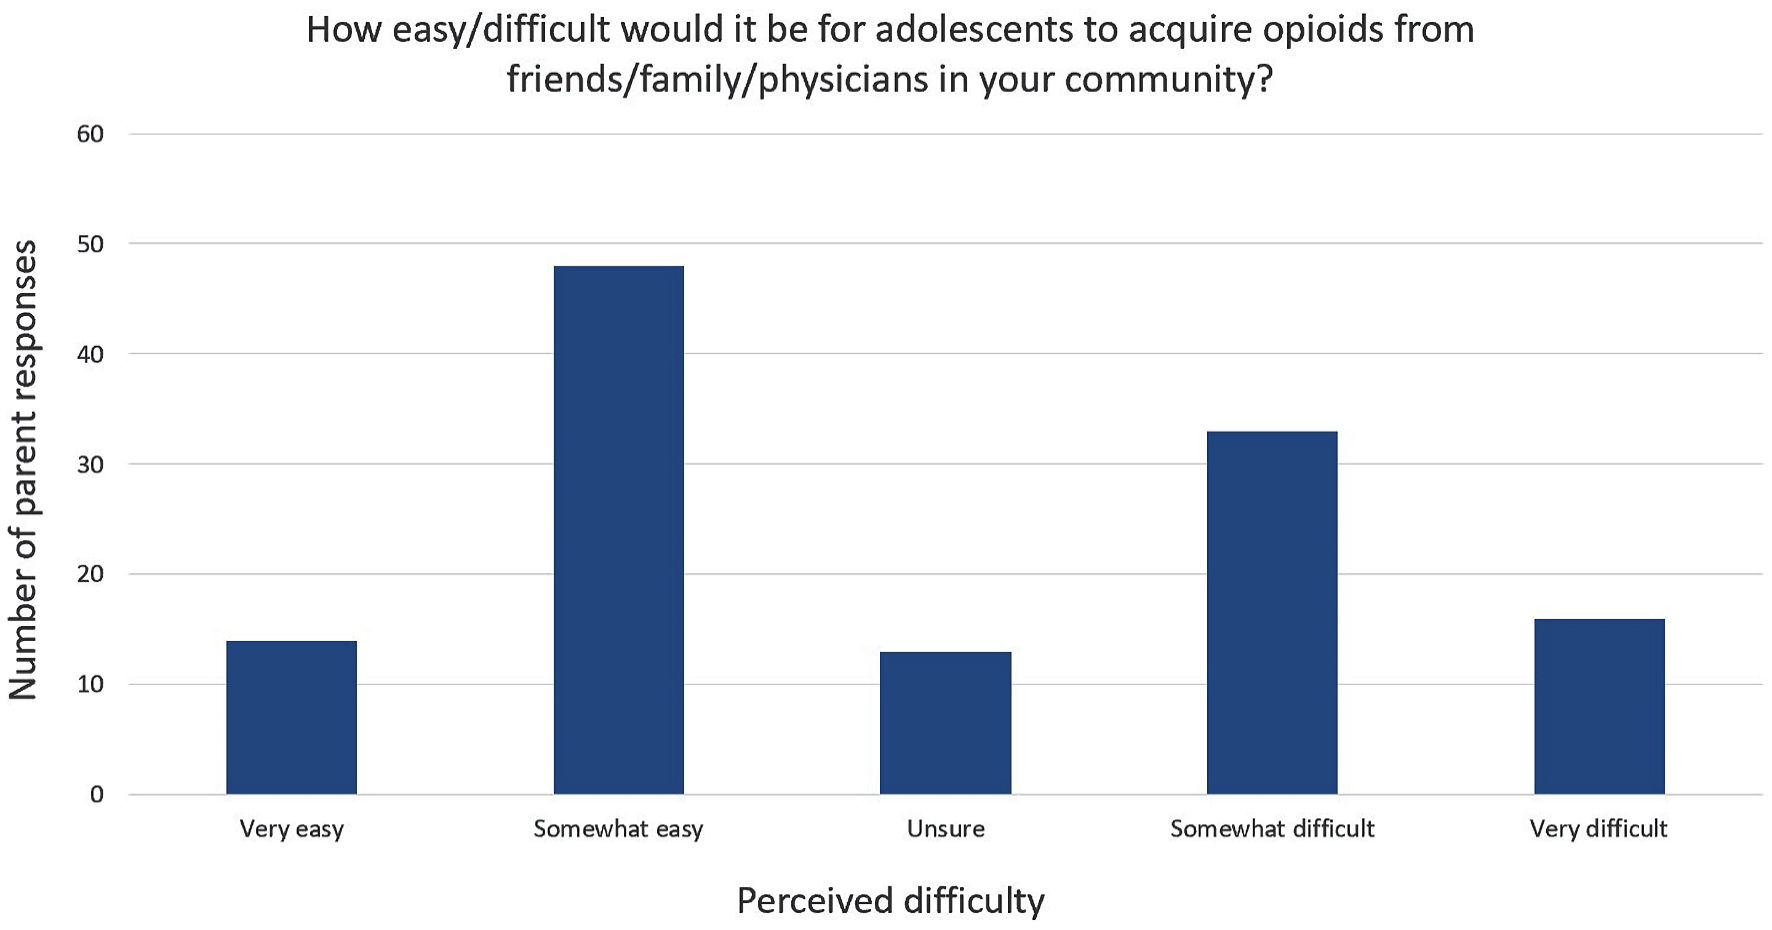
Figure 1. Copy of the RedCap survey completed by parents during their children’s preoperative stay in the surgery unit.
| International Journal of Clinical Pediatrics, ISSN 1927-1255 print, 1927-1263 online, Open Access |
| Article copyright, the authors; Journal compilation copyright, Int J Clin Pediatr and Elmer Press Inc |
| Journal website https://www.theijcp.org |
Original Article
Volume 12, Number 1, May 2023, pages 3-10
Parental Perceptions Regarding Prescription Opioid Use for Pain Control in Children Following Orthopedic Surgery
Figures
Tables
| aData are missing from two patients. SD: standard deviation. | |
| Child’s age (mean ± SD) | 11.3 ± 4.2 |
| Child’s age (median: Q1, Q3) | 13.0: 8.0, 15.0 |
| Gender female/male | 63/60a |
| Number (%) | |
|---|---|
| aNumbers may not total the study cohort number of 125 due to unanswered questions. Percentages are calculated based on number answering the specific question. | |
| Relationship to child | |
| Father | 26 (21.1) |
| Grandparent | 5 (4.1) |
| Legal guardian | 4 (3.3) |
| Mother | 88 (71.5) |
| Marital status | |
| Divorced or separated | 16 (13.1) |
| Married or domestic partner | 81 (66.4) |
| Single, never married | 25 (20.5) |
| Highest degree of education | |
| Advanced degree | 23 (19.0) |
| Bachelor’s degree | 16 (13.2) |
| Between high school and college | 58 (47.9) |
| High school graduate, diploma, or equivalent | 21 (17.4) |
| Some high school, no diploma | 3 (2.5) |
| Employment status | |
| Employed for wages | 85 (69.7) |
| Not working | 8 (6.6) |
| Out of work and looking for work | 2 (1.6) |
| Self-employed | 12 (9.8) |
| Stay at home parent | 14 (11.5) |
| Student | 1 (0.8) |
| Self-identified race or ethnicity | |
| Asian | 2 (1.7) |
| Black or African American | 13 (10.7) |
| Multiracial | 3 (2.5) |
| White | 103 (85.1) |
| Hispanic | |
| Ethnicity, Hispanic (yes/no) | |
| No | 117 (97.5) |
| Yes | 3 (2.5) |
| Primary language spoken at home | |
| English | 118 (98.3) |
| Other | 2 (1.7) |