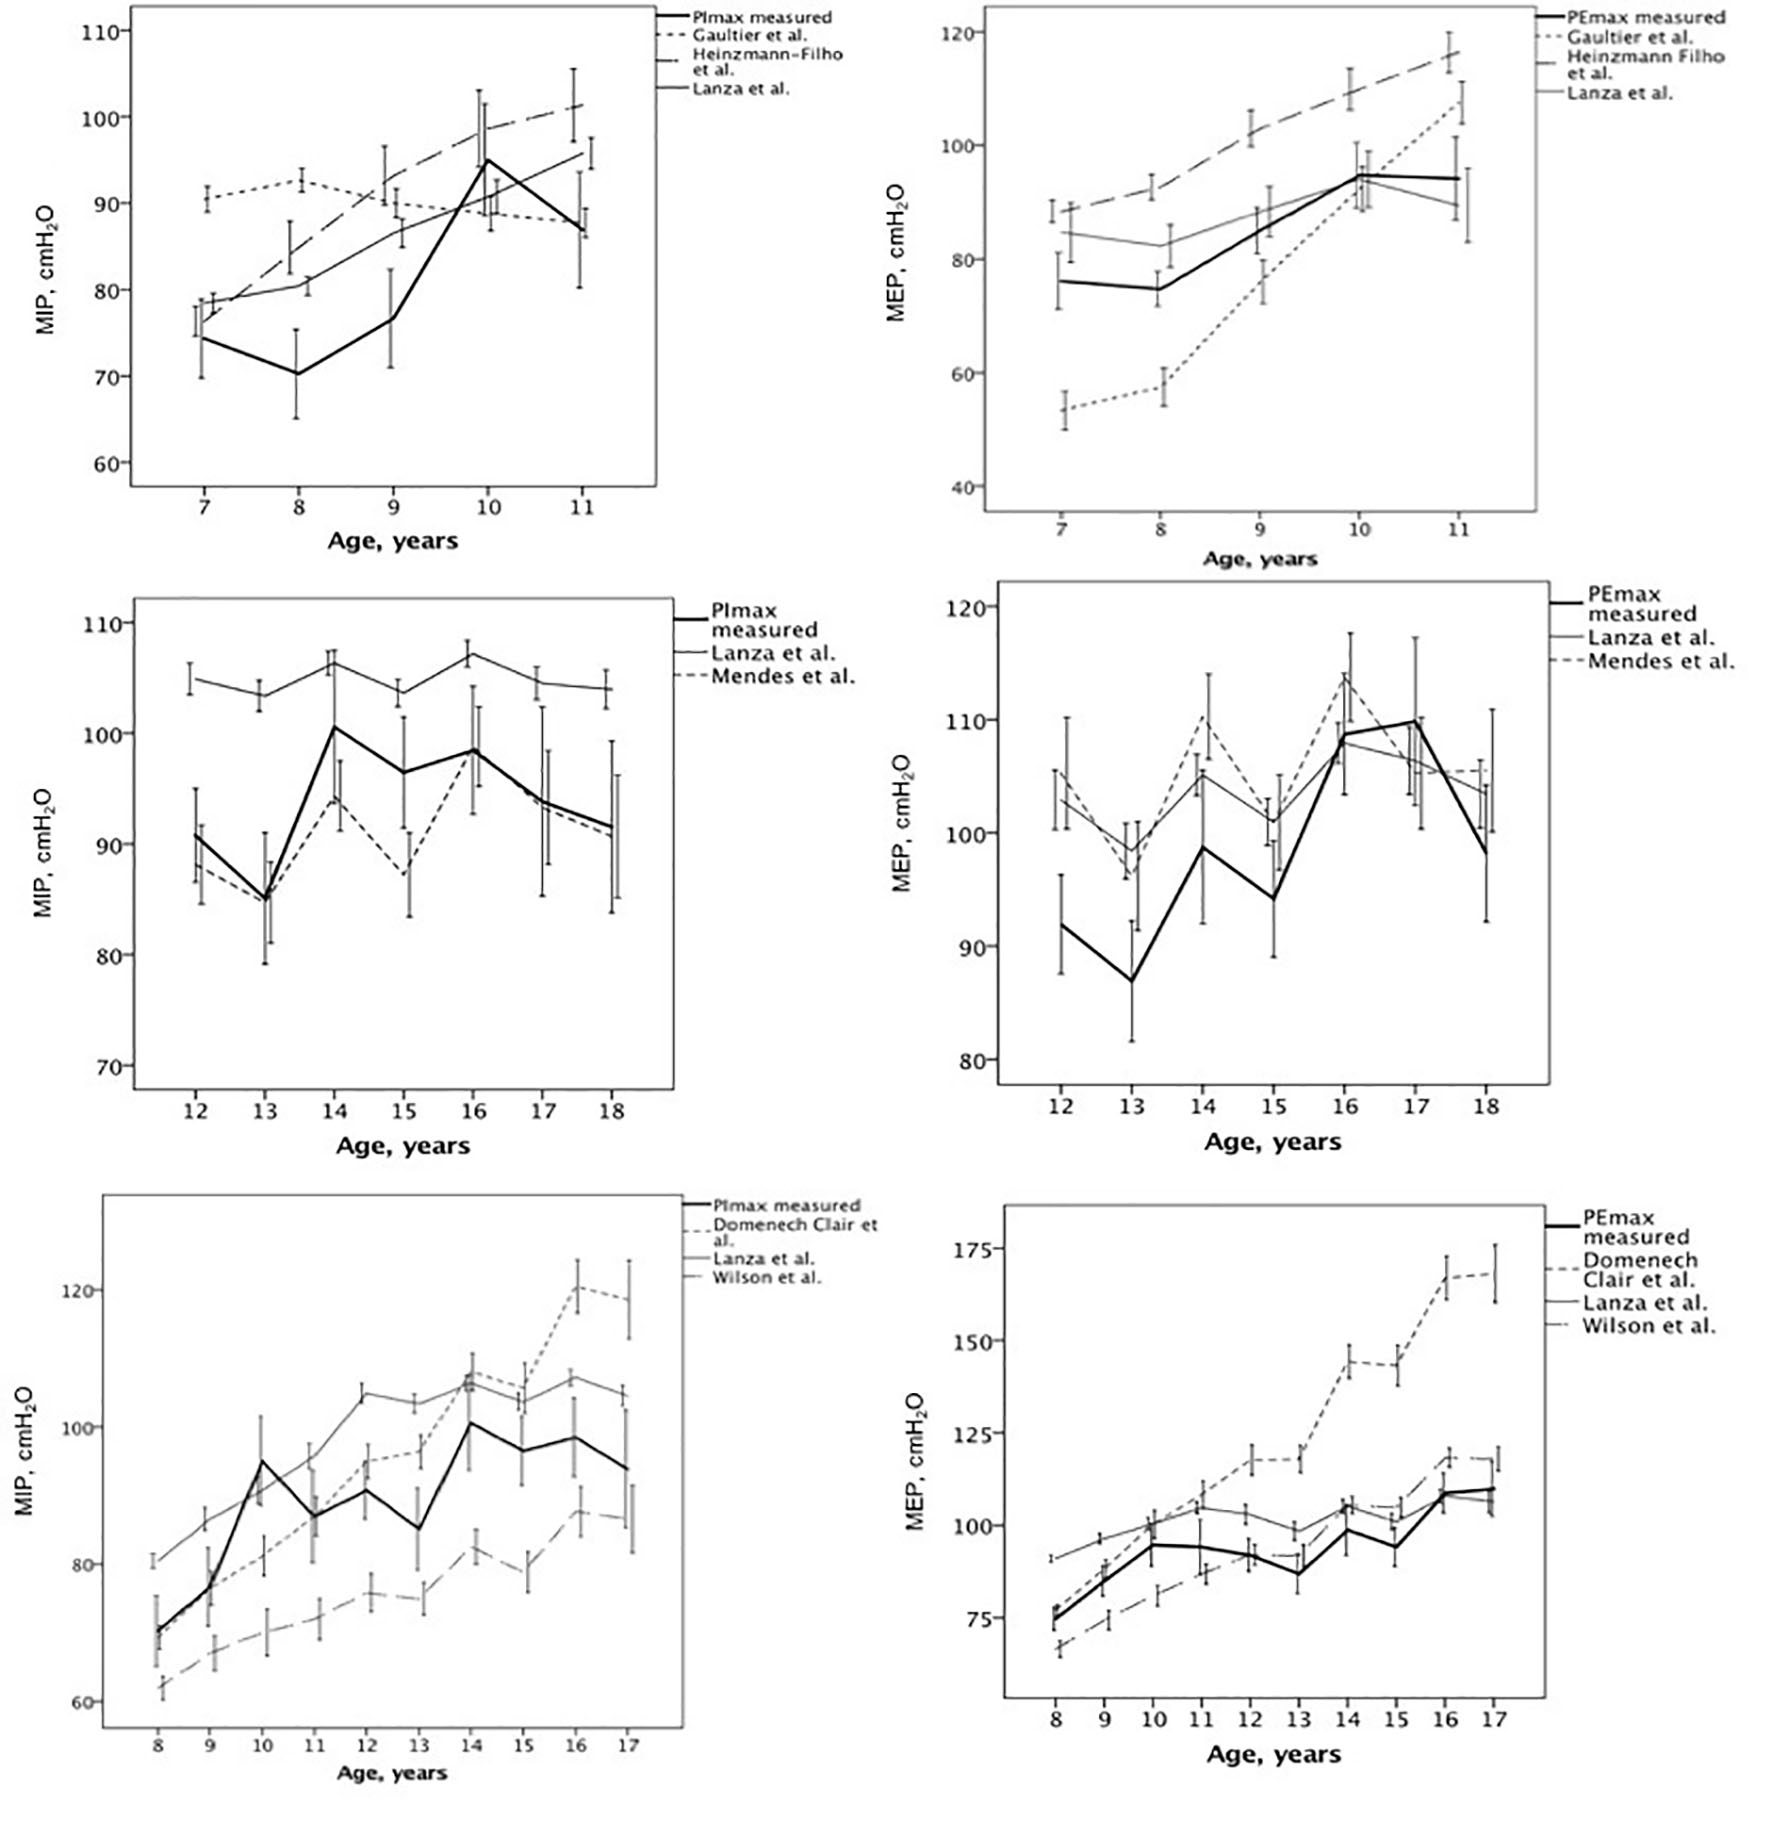
Figure 1. Measured and predicted maximal respiratory pressure values for each equation described [9-11, 13-15].
| International Journal of Clinical Pediatrics, ISSN 1927-1255 print, 1927-1263 online, Open Access |
| Article copyright, the authors; Journal compilation copyright, Int J Clin Pediatr and Elmer Press Inc |
| Journal website https://www.theijcp.org |
Original Article
Volume 12, Number 2, September 2023, pages 37-44
Are the Reference Equations for Maximal Respiratory Pressure in Children Adequately Predicting Their Value?
Figure
Tables
| Author (n), country | Age (years) | Equation | R2 | |
|---|---|---|---|---|
| aSex male = 1, female = 0. bSex male = 1; female = 2; age: years old; weight in kg; height in centimeter. cHeight in meter. MIP: maximal inspiratory pressure; MEP: maximal expiratory pressure. | ||||
| Heinzmann et al [11] (n = 171), Brazil | MIP, male | 4 - 12 | 17.879 - (0.674 × height) - (0.604 × weight) | 0.58 |
| MIP, female | 4 - 12 | 14.226 - (0.551 × height) - (0.638 × weight) | 0.58 | |
| MEP, male | 4 - 12 | 47.417 + (0.898 × weight) + (3.166 × age) | 0.46 | |
| MEP female | 4 - 12 | 30.045 + (0.749 × weight) + (4.213 × age) | 0.51 | |
| Mendes et al [13] (n = 182), Brazil | MIP | 12 - 18 | 53.8 + (26.1 × sex) + (0.4 × weight) | 0.27 |
| MEP | 12 -18 | 86.85 + (34.22 × sex) | 0.27 | |
| Lanza et al [9] (n = 450), Brazil | MIP | 6 - 11 | 37.458 - 0.559 + (age × 3.253) + (BMI × 0.843) + (age × sexa × 0.985) | 0.34 |
| MEP | 6 - 11 | 38.556 + 15.892 + (age × 3.023) + (BMI × 0.579) + (age × sexa × 0.881) | 0.31 | |
| MIP | 12 - 18 | 92.472 + (sexa × 9.894) + 7.103 | 0.27 | |
| MEP | 12 - 18 | 68.113 + (sexa × 17.022) + 6.46 + (BMI × 0.927) | 0.34 | |
| Domenech-Clar et al [10] (n = 392), Spain | MIP, male | 8 - 17 | -27.020 - (4.132 × age) - (0.003 × height × weight) | 0.40 |
| MIP, female | 8 - 17 | -33.854 - (1.814 × age) - (0.004 × height × weight) | 0.21 | |
| MEP, male | 8 - 17 | 7.619 + (7.806 × age) + (0.004 × height × weight) | 0.51 | |
| MEP, female | 8 - 17 | 17.066 + (7.22 × age) | 0.28 | |
| Wilson et al [14] (n = 235), United Kingdom | MIP, male | 7 - 17 | 44.5 + (0.75 × weight) | 0.16 |
| MEP, male | 7 - 17 | 35 + (5.5 × age) | 0.35 | |
| MIP, female | 7 - 17 | 40 + (0.57 × weight) | 0.11 | |
| MEP, female | 7 - 17 | 24 + (4.8 × age) | 0.34 | |
| Gaultier et al [15] (n = 119), Canada | MIP | 7 - 13 | -92.68 - (11.56 × sexb) + (15.00 × heightc) | 0.27 |
| MEP | 7 - 13 | -11.32 + (14.22 × age) - (25.7 × sexb) | 0.33 | |
| Respiratory muscle strength | Mean difference between measured and predicted values (95% CI) | P | ICC (95% CI) | P | |
|---|---|---|---|---|---|
| MIP: maximal inspiratory pressure; MEP: maximal expiratory pressure; CI: confidence interval; ICC: intraclass correlation coefficient. | |||||
| MIP, cm H2O | |||||
| Measured (n = 64) | 80 ± 22 | - | - | - | - |
| Predicted by Gaultier et al [15] | 90 ± 6 | -9 (-18 to -1) | 0.013 | -0.3 (-1.1 - 0.1) | 0.94 |
| Predicted by Heinzmann et al [11] | 90 ± 15 | -10 (-17 to -3) | 0.002 | 0.6 (0.3 - 0.7) | < 0.001 |
| Predicted by Lanza et al [9] | 86 ± 8 | -6 (-13 to - 1) | 0.129 | 0.5 (0.1 - 0.6) | 0.004 |
| MEP, cm H2O | |||||
| Measured (n = 64) | 84 ± 21 | - | - | - | - |
| Predicted by Gaultier et al [15] | 76 ± 25 | 8 (0 - 15) | 0.036 | -0.6 (0.4 - 0.8) | < 0.001 |
| Predicted by Heinzmann et al [11] | 101 ± 15 | -17 (-23 to -10) | < 0.001 | 0.5 (-0.1 - 0.7) | < 0.001 |
| Predicted by Lanza et al [9] | 96 ± 7 | -12 (-18 to -6) | < 0.001 | 0.4 (0.1 - 0.7) | 0.001 |
| Respiratory muscle strength | Mean difference between measured and predicted values (95% CI) | P | ICC (95% CI) | P | |
|---|---|---|---|---|---|
| MIP: maximal inspiratory pressure; MEP: maximal expiratory pressure; CI: confidence interval; ICC: intraclass correlation coefficient. | |||||
| MIP, cm H2O | |||||
| Measured (n = 100) | 96 ± 28 | - | - | - | - |
| Predicted by Lanza et al [9] | 105 ± 5 | -10 (-16 to -3) | 0.002 | 0.2 (-0.1 - 0.5) | 0.108 |
| Predicted by Mendes et al [13] | 92 ± 15 | 4 (-3 - 10) | 0.466 | 0.5 (0.2 - 0.6) | 0.001 |
| MEP, cm H2O | |||||
| Measured (n = 100) | 98 ± 24 | - | - | - | - |
| Predicted by Lanza et al [9] | 104 ± 9 | -6 (-11 - 1) | 0.013 | 0.4 (0.2 - 0.6) | 0.001 |
| Predicted by Mendes et al [13] | 106 ± 17 | -8 (-14 to -3) | 0.001 | 0.6 (0.4 - 0.7) | < 0.001 |
| Respiratory muscle strength | Mean difference between measured and predicted values (95% CI) | P | ICC (95% CI) | P | |
|---|---|---|---|---|---|
| MIP: maximal inspiratory pressure; MEP: maximal expiratory pressure; CI: confidence interval; ICC: intraclass correlation coefficient. | |||||
| MIP, cm H2O, n = 137 | |||||
| Measured | 92 ± 27 | - | - | - | - |
| Predicted by Domenech-Clar et al [10] | 98 ± 20 | -6 (-12 - 0) | 0.055 | 0.6 (0.4 - 0.7) | < 0.00 |
| Predicted by Lanza et al [9] | 99 ± 10 | -8 (-13 to -2) | 0.003 | 0.5 (0.3 - 0.6) | < 0.001 |
| Predicted by Wilson et al [14] | 77 ± 14 | 15 (9 - 21) | < 0.001 | 0.5 (0.2 - 0.6) | < 0.001 |
| MEP, cm H2O, n = 138 | |||||
| Measured | 94 ± 23 | - | - | - | - |
| Predicted by Domenech-Clar et al [10] | 126 ± 34 | -32 (-39 to -25) | < 0.001 | 0.5 (-0.1 - 0.7) | < 0.001 |
| Predicted by Lanza et al [9] | 102 ± 9 | -8 (-12 to -3) | < 0.001 | 0.5 (0.3 - 0.7) | < 0.001 |
| Predicted by Wilson et al [14] | 96 ± 19 | -2 (-6 - 3) | 1.0 | 0.7 (0.6 - 0.8) | < 0.001 |