

| International Journal of Clinical Pediatrics, ISSN 1927-1255 print, 1927-1263 online, Open Access |
| Article copyright, the authors; Journal compilation copyright, Int J Clin Pediatr and Elmer Press Inc |
| Journal website https://www.theijcp.org |
Original Article
Volume 12, Number 2, September 2023, pages 37-44

Are the Reference Equations for Maximal Respiratory Pressure in Children Adequately Predicting Their Value?
Natalia Marcolina, f, Pedro Dal Lagoa, Jaksoel Cunha Silvab, Jenifer Dos Santosb, Luana Cefora Godoy Silvae, Simone Dal Corsoc, d, Fernanda Cordoba Lanzae
aDepartment of Physical Therapy, Universidade Federal de Ciencias da Saude de Porto Alegre, Porto Alegre, Rio Grande do Sul, Brazil
bDepartment of Physical Therapy, Universidade Nove de Julho, Sao Paulo, Brazil
cUniversidade Nove de Julho, Graduate Program in Rehabilitation Sciences, Sao Paulo, Brazil
dCentral Clinical School, Monash University, Melbourne, Australia
eDepartment of Physical Therapy, Universidade Federal de Minas Gerais, Belo Horizonte, Minas Gerais, Brazil
fCorresponding Author: Natalia Marcolin, Department of Physical Therapy, Universidade Federal de Ciencias da Saude de Porto Alegre, St Sarmento Leite, 245, Porto Alegre, Rio Grande do Sul, Brazil
Manuscript submitted June 8, 2023, accepted June 22, 2023, published online August 2, 2023
Short title: Maximal Respiratory Pressure in Children
doi: https://doi.org/10.14740/ijcp517
| Abstract | ▴Top |
Background: This study aimed to investigate the agreement between the measured and estimated respiratory muscle strength in children and adolescents. We hypothesized that when using reference muscle strength equation consistent with the characteristics of the sample population, there would not be differences between the measured and predicted values.
Methods: This was a cross-sectional study. One hundred seventy-nine participants were healthy volunteers between 6 and 18 years of age. Those who had lung disease in the previous 4 weeks, abnormalities in the pulmonary function test, chronic cardiopulmonary disease, prematurity or inadequacy when performing the tests were excluded. Maximal inspiratory and expiratory pressures (MIP and MEP) were assessed according to recommendations. The measured MIP and MEP values were compared to predicted values of the six most frequently cited prediction equations for children and adolescents.
Results: Mean age was 12.3 ± 3.7 years and 54% were male. The mean MIP was 87.5 ± 27.1 cm H2O and MEP was 90.8 ± 23.6 cm H2O. Three predicted MIP equations had similar results to the measured values (P > 0.05). For MEP, only one equation had similar values (P = 0.12). Instead, there was weak to moderate agreement of all equations. At Bland-Altman plots, the mean bias was greater than 6 cm H2O for all equations, and the 95% confidence interval (CI) was about 30 cm H2O.
Conclusion: There is significant variability between measured and predicted MIP and MEP values. Some equations showed similarity to measured values; however, the reliability was poor.
Keywords: Respiratory muscle strength; Reference equation; Children
| Introduction | ▴Top |
The assessment of respiratory muscle strength allows the identification of respiratory muscle weakness and is indicative of the severity of several pulmonary [1, 2] and neuromuscular [3, 4] dysfunctions. It is also used to evaluate responses to the intervention [5, 6] and in the decision to wean and extubate the subjects [7]. Transdiaphragmatic pressure and phrenic nerve stimulation are considered the gold standard for assessing respiratory muscle strength [6]. However, these methods require costly equipment and highly trained professionals. In this context, voluntary and non-invasive methods stand out because they are inexpensive and can be performed in clinical practice [8].
To accurately interpret the results of the respiratory muscle strength evaluation, it is necessary to compare them with normative values. There are several prediction equations for respiratory muscle strength [9-15] and established mean values for inspiratory and expiratory pressures [16, 17] in the pediatric population. These equations usually consider the age, sex, and anthropometric characteristics (weight and height) as predictions variables. Inter and intrasubject variabilities in volitional measurements [18] lead to different values between the measured and predicted inspiratory and expiratory pressures. However, this has yet to be investigated in the pediatric population.
It is worth identifying whether the prediction equation presents better concordance with the actual measured value in the pediatric population. Thus, a question arises: which prediction equation or established mean value of the inspiratory and expiratory muscle strength would be more representative of the measured value in the pediatric population? We hypothesized that when using equations consistent with the characteristics of the sample population, there would not be differences between the measured and predicted values. This study aimed to investigate the agreement between the measured and estimated respiratory muscle strength in children and adolescents.
| Materials and Methods | ▴Top |
Subjects
Healthy volunteers between 6 and 18 years of age were recruited in public schools of Porto Alegre, Brazil. They were excluded if they had experienced acute pulmonary disease in the previous 4 weeks, abnormalities in the lung function test (< 80% of the predicted value), some chronic cardiopulmonary disease, born prematurely, or improper performance on the tests.
Ethical issues and informed consent
Subjects were enrolled in the study after the informed consent form had been read, agreed to, and signed by both the subject and legal guardian. The study was approved by the local ethical committee (#483692) and was conducted in compliance with the ethical standards of the responsible institution on human subjects as well as with the Helsinki Declaration.
Study design and protocol
This was a cross-sectional study. During a single visit, subjects underwent spirometry, and their maximal inspiratory and expiratory respiratory pressures were measured. Spirometry was performed using MiniSpir (MIR Medical International Research, Roma, Italy) with a calibrated pneumotachograph (CPFS/D USB; Medical Graphics, St. Paul, MN, USA). The technical procedure, acceptance criteria and reproducibility were in accordance with the American Thoracic Society (ATS)/European Respiratory Society (ERS) statement [19]. The forced vital capacity (FVC), forced expiratory volume at the first second (FEV1), the relation FEV1/FVC, and forced expiratory flow at 25-75% of FVC (FEF25-75) were expressed in liters and as a percentage of the predicted value [20].
The maximal inspiratory pressure (MIP) and maximal expiratory pressure (MEP) were obtained using the following guidelines [6]. Respiratory muscle strength was measured using an aneroid-type manometer (± 150 cm H2O for children and ± 300 cm H2O for adolescents; MVD 300, GeRar®, Porto Alegre, RS, Brazil). An experienced operator briefly explained the required maneuver and demonstrated it visually to the volunteer. The MIP was measured after maximal expiration (from residual volume), and the MEP was measured after maximal inspiration (from total lung capacity). The volunteers stood and wore nose clips during the test. The maneuver was recorded when there was a plateau of at least 1 s, visually observed. At least five measurements were performed, and the test was concluded when three of them did not differ by more than 10%. A resting period of 1 min was allowed between each MIP and MEP maneuver. The best MIP and MEP values were used for analysis.
For comparisons between the measured respiratory muscle strength and the predicted values, the equations used were from Heinzmann-Filho et al [11], Mendes et al [13], and Lanza et al [9] because these studies used the same population as the present one. Additionally, this study utilized the most common MIP and MEP prediction equations, including the equation by Domenech-Clar et al [10] that was developed in Spain with a large number of volunteers (n = 392), the equations of Wilson et al [14] and Gaultier et al [15], which were the first created for the infant population. Because each prediction equation was described for subjects with different ages (4 - 12 years [11], 12 - 18 years [13], 6 - 18 years [9], 8 - 17 years [10], 7 - 17 years [14], and 7 - 13 years [15]), comparisons were made between those equations with similar age groupings. Table 1 describes the equations used. Studies from the Netherlands [17] and Canada [16] described normality values, but no equations were used. For this reason, no comparisons were made.
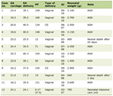 Click to view | Table 1. Reference Equations for Respiratory Muscle Strength |
Statistical analyses
The normality of the data was analyzed using the Kolmogorov-Smirnov test. The data showed a parametric distribution and were expressed as mean (standard deviation) or 95% confidence interval (CI).
The measured respiratory muscle strengths (MIP and MEP) were considered the value assessed of the 179 included volunteers. Thus, the measured MIP and MEP were compared to the predicted values by repeated analysis of variance (ANOVA) and Bonferroni post hoc test. Considering the different ages for each equation, the measured MIP and MEP were compared to the predicted equations for children [9, 11, 15], predicted equations for adolescents [9, 13], and predicted equations for whole pediatric group [9, 10, 14].
The intraclass correlation coefficient (ICC) and 95% CI were used to assess the agreement between the measured respiratory muscle strength and predicted values of each equation. The measured values were correlated to the predicted values for children, then for adolescents, and then for whole sample. Agreement was classified as follows: 0.00 = absence, 0.00 - 0.39 = mild, 0.40 - 0.59 = moderate, 0.60 - 0.79 = substantial, > 0.80 = excellent [21]. The Bland-Altman analysis was performed between the measured and predicted MIP and MEP [22].
The probability of a type I error was established at 0.05 for all tests. The SPSS statistical package version 20 (SPSS, Chicago, IL, USA) was used.
| Results | ▴Top |
A total of 197 volunteers were selected, and of these, 18 were excluded (four did not accept to participate, eight had acute lung disease or were born prematurely, three missed school the day of the assessment, two had reduced lung function tests, and one failed to perform the maneuvers). Thus, 179 volunteers completed the assessment of respiratory muscle strength, and 96 (54%) were male, mean age of 12.3 ± 3.7 years old; body mass index of 20.1 ± 4.1 kg/m2; mean MIP of 87.5 ± 27.1 cm H2O, mean MEP of 90.8 ± 23.6 cm H2O. Of the total sample, 51% (n = 92) were between 6 and 12 years old, and 49% (n = 87) were between 13 and 18 years old.
The measured respiratory muscle strength of the volunteers between 6 and 13 years old was compared to the predicted values based on the equations by Gaultier et al [15], Heinzmann-Filho et al [11], and Lanza et al [9]. The predicted equations from Gaultier et al [15] and Heinzmann-Filho et al [11] overestimated about 10% of the measured MIP (P < 0.05; Table 2); however, the MIP predicted by Lanza et al [9] was similar to the measured result (P = 0.12). Regarding MEP, the predicted values based on the equations by Heinzmann-Filho et al [11] and Lanza et al [9] overestimated more than 15% compared to the measured MEP (P < 0.05), while that of Gaultier et al [15] underestimated the measured MEP values (P = 0.036; Table 2). The ICC between the measured MIP and the equation by Gaultier et al [15] was mild and non-significant (P = 0.94). For the other equations, the ICC was moderate (Table 2).
Click to view | Table 2. Comparison Between Measured Respiratory Muscle Strength and Gaultier et al (7 - 13 Years Old), Heinzmann et al (4 - 12 Years Old) and Lanza et al (6 - 11 Years Old) Predicted Equations |
The measured values of MIP and MEP of adolescents between 12 and 18 years old were compared with the predicted values based on the equations by Lanza et al [9] and Mendes et al [13]. The equation by Lanza et al [9] overestimated about 10% of the MIP measured (P = 0.002); however, the MIP values predicted by Mendes et al [13] were similar to the measured value (P > 0.05; Table 3). There was a small (less than 10%) but significant difference between the MEP predicted by both equations and the measured value (P < 0.05, Table 3). The ICC was non-significant between the measured MIP and the predicted value using the equation by Lanza et al [9] (P = 0.108). There was moderate agreement for the other equations (P < 0.05; Table 3).
Click to view | Table 3. Comparison Between Measured Respiratory Muscle Strength and Lanza et al (12 - 18 Years Old) and Mendes et al (12 - 18 Years Old) Predicted Equations |
Three prediction equations for MIP and MEP were described for the entire population (6 to 17 years old: Lanza et al [9], Domenech-Clar et al [10], Wilson et al [14]). There was no significant difference between the measured MIP and the predicted value using the equation by Domenech-Clar et al [10] (P = 0.055). A small (less than 10%) but significant difference was observed between the measured value and the predicted value using the equation by Lanza et al [9] (P = 0.003; Table 4). The predicted value by Wilson et al [14] underestimated the MIP (p < 0.001). The MEP predicted by Domenech-Clar et al [10] overestimated the measured value by more than 25% (P < 0.001). The predicted value by Lanza et al [9] had a smaller difference (about 8%); however, this was still significant (P < 0.001; Table 3). There was no difference between the measured MIP and that predicted by Wilson et al’s [14] equation. All these ICC measurements had moderate to substantial agreement (P < 0.05).
Click to view | Table 4. Comparison Between Measured Respiratory Muscle Strength and Domenech-Clar et al (8 - 17 Years Old), Lanza et al (8 - 18 Years Old), and Wilson et al (7 - 17 Years Old) Predicted Equations |
Figure 1 shows the measured and predicted maximal respiratory pressure values for each equation. Most of the equations overestimated the measured values of MIP and MEP. About the Bland-Altman graph, there is high variability between the measured respiratory muscle strength and the predicted values, the bias was higher than 6 cm H2O, and the 95% CI was between 20 and 40 cm H2O.
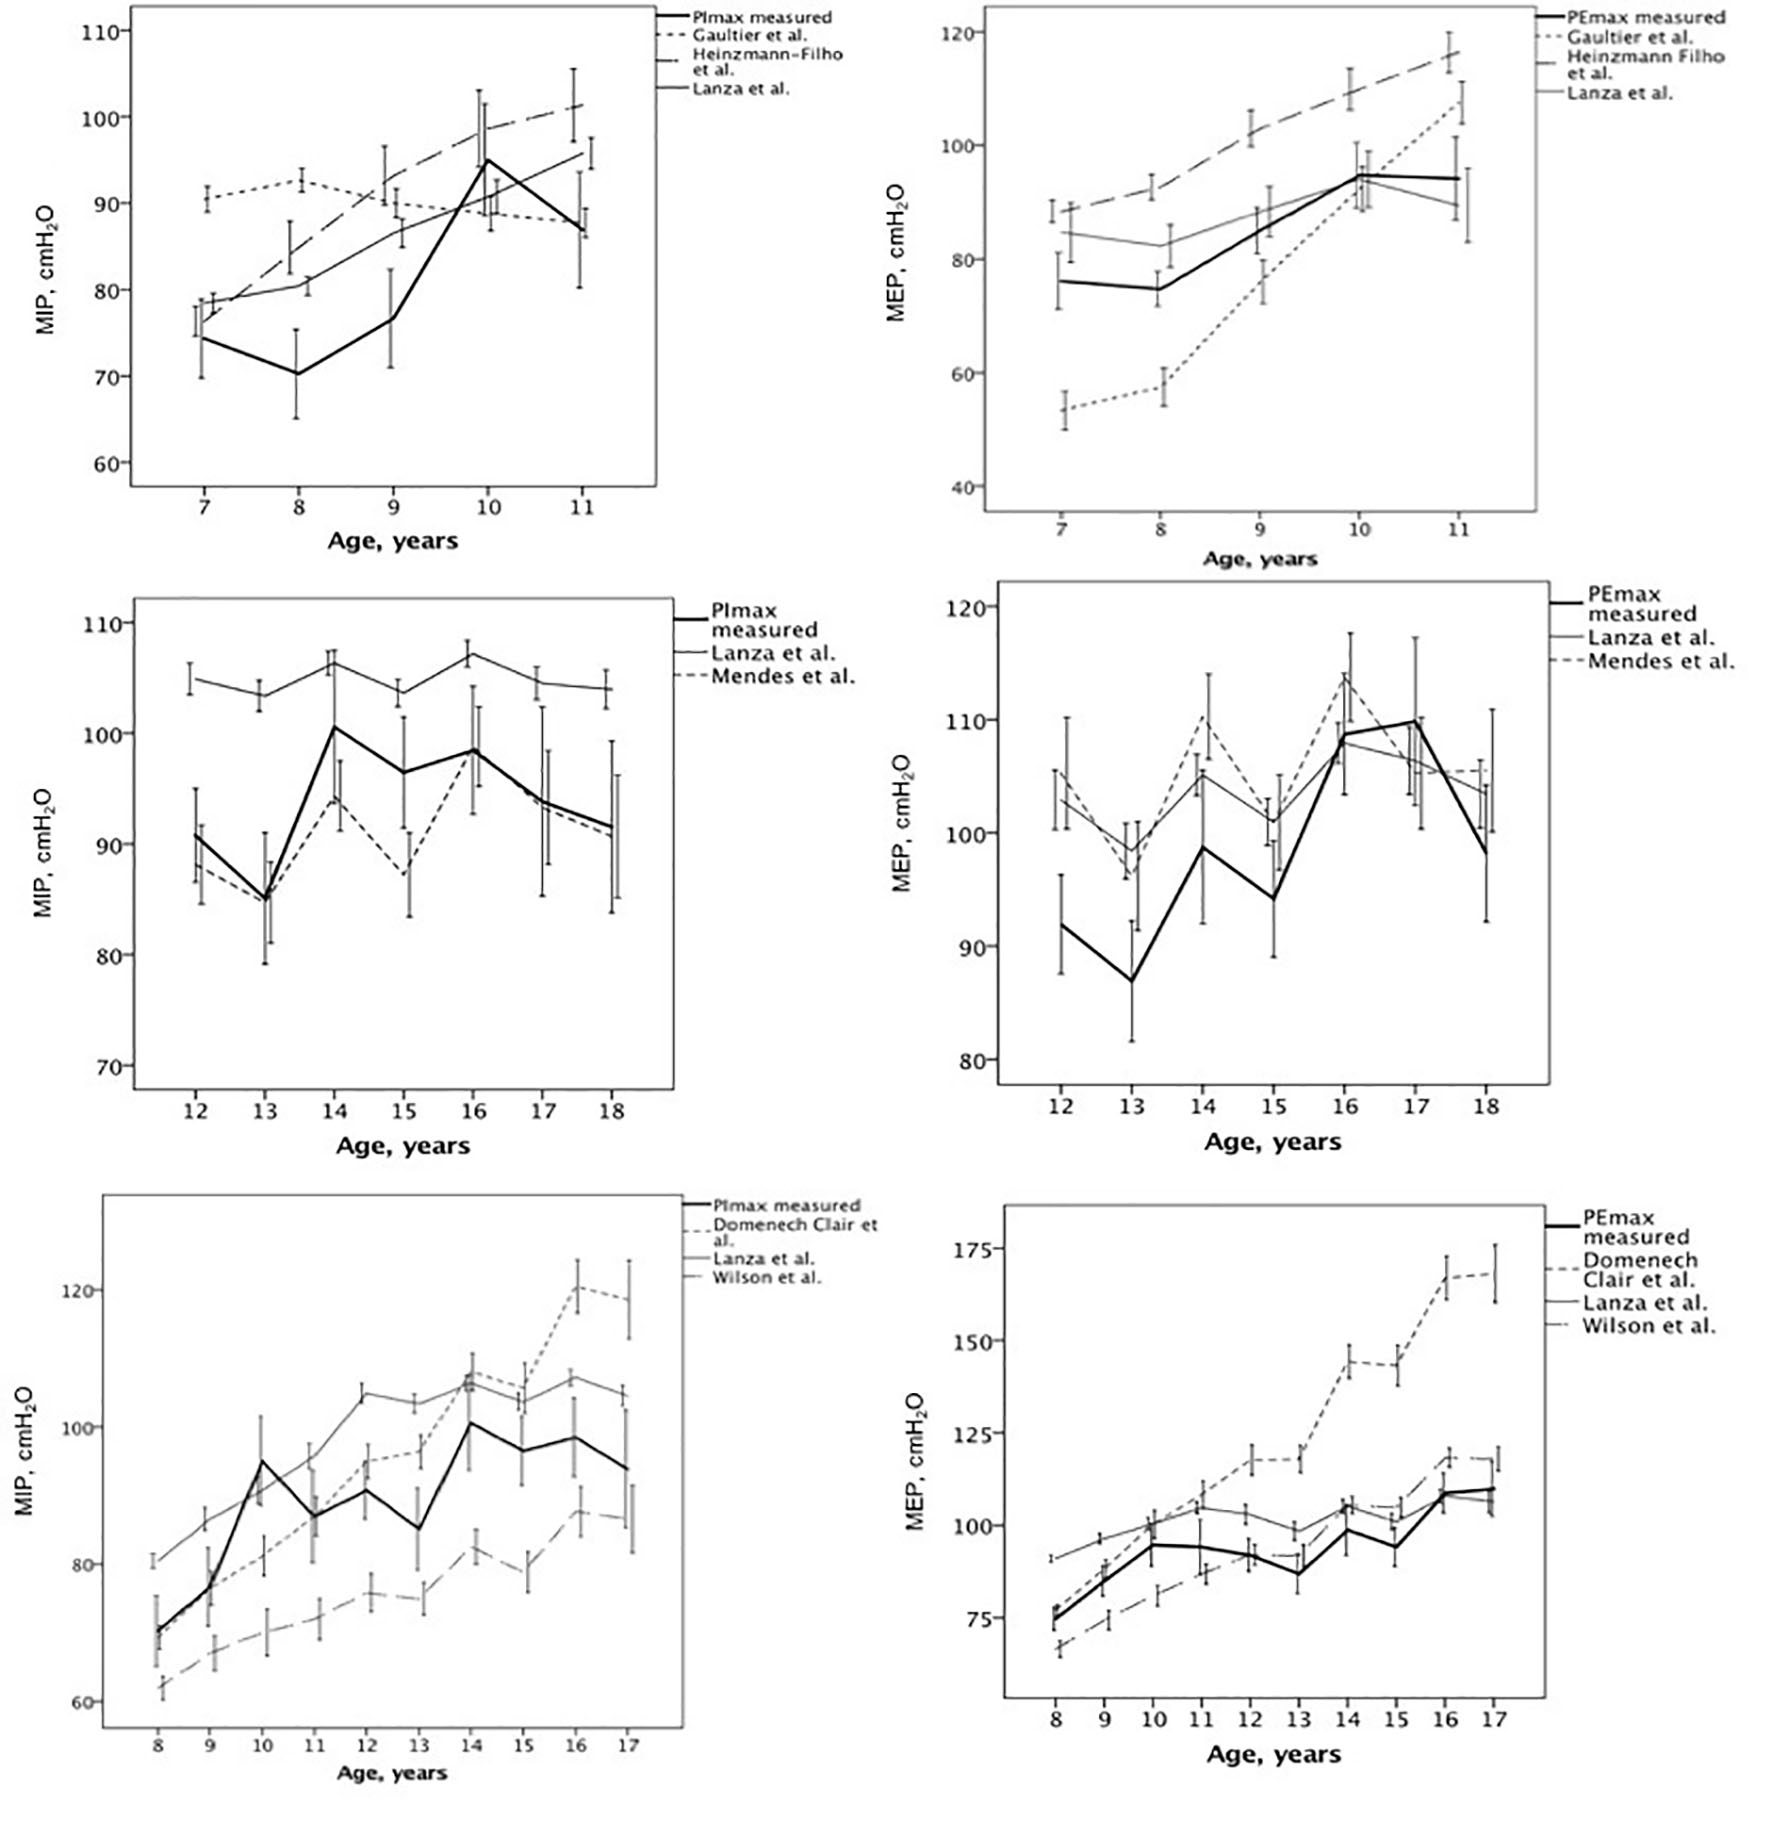 Click for large image | Figure 1. Measured and predicted maximal respiratory pressure values for each equation described [9-11, 13-15]. |
| Discussion | ▴Top |
This study compared the measured and predicted values of maximal respiratory pressure for children and adolescents using six equations from the literature. For three of them [9, 10, 13], the predicted MIP value was similar to the measured one, and for only one of these [9], the predicted MEP was significantly different from the measurement. The agreement of all equations was weak to moderate, with significant variability between the measured and predicted values.
Many reference equations for respiratory muscle strength have been developed in different countries because of the influence of anthropometric and ethnicity variables [10, 14, 23, 24]. Johan et al [25] compared the maximal respiratory pressures of the Chinese, Malaysian, and Indian populations and concluded that an equation needed to be developed for that population to avoid misinterpretation. In contrast, Sachs et al [26] did not observe differences in MIP among volunteers from four ethnic groups in the United States (whites, Hispanics, African Americans, and American Chinese); however, all of them were born in the USA.
All of the results of the equations developed to predict respiratory muscle strength in children (< 12 years old) [9, 11, 15] were significantly different from the measured values, with the exception of MIP in one equation [9]. Although the equation by Gaultier et al [15] had different predicted values compared to the measured MIP and MEP, the difference was only about 10%. Cox et al [27] suggested that a difference of less than 10% between the predicted and measured values is feasible in clinical practice.
Regarding the predicted equations for adolescents, one properly predicted MIP but overestimated MEP (less than 10%) [13]. The values from the equation by Lanza et al [9] were mathematically different from the measured MIP and MEP values, overestimating by approximately 12%.
For the equations that included volunteers 6 to 17 years old, one overestimated less than 10% of MIP and MEP [9]. The equation by Domenech-Clar et al [10] predicted a similar MIP but overestimated (> 25%) the MEP. The equation by Wilson et al [14] predicted a similar MEP but underestimated (about 16%) the MIP.
This scenario seems to reinforce that reference respiratory muscle strength equations cannot predict exact value, particularly for children. Some factors, such as the subject’s understanding, and the mathematical model, may explain the variability in these results. The most significant value for R2 between the studied equations and the measured value came from Heinzmann-Filho et al [11], who stated that height and weight explained 58% of the MIP and MEP variation. However, other variables such as the amount of free-fat mass, pubertal stage, and rib cage compliance can influence respiratory muscle strength. This is why predicted equations cannot agree with 100% of the measured values, because some outcomes for the logistic equation model are difficult to measure in clinical practice.
The higher variability observed in the present study can be because MIP and MEP are volitional tests, which are dependent on the volunteer’s understanding and motivation [6]. Although the studies used MIP and MEP according to international standardization, this evaluation can present huge variability for young volunteers.
Unfortunately, contrary to the hypothesis of the authors, the ICC between measured and predicted values was weak, and there were wide CIs. These data show that the equations do not have good agreement with the measured values.
Similarly, the Bland-Altman analysis showed high variability among the measures. The mean bias was greater than 6 cm H2O for all analyses, and the CI was around 30 cm H2O (about 30% of the measured value). In other words, the prediction equations could be wrong by as much as 30% of the measured value.
Two recently published studies mentioned that prediction equations for respiratory muscle strength may not adequately provide normal values. Delgado et al [28] observed large variability between measured and predicted values for 144 children with ages 7 to 11 years. Similarly, Rodrigues et al [18] compared clinical diagnoses of respiratory muscle weakness in adults to those based on prediction equations. Most equations underestimated the respiratory muscle weakness, and the authors suggested MIP and MEP should be used for screening and not for definitive diagnoses.
In the present study, the equations tested did not have full agreement with measured maximal respiratory pressures. Some equations better predicted MIP [9, 10, 13], whereas others were better for MEP [14, 15]. The equation by Lanza et al [9] had less than 10% difference for MIP and MEP.
This study implies that the reference equations for respiratory muscle strength for children and adolescents should be used with caution. Even if the average of the values measured was similar to some predicted values, there was great variability between measured and predicted values. Thus, it is important to have in mind that the cited reference equation may overestimate muscle strength values. In other words, a volunteer would present normal respiratory muscle strength based on the predicted equation; however, he/she might have a weakness. Thus, the choice of reference equation must be demanded by similarities between the measured population and the sample used in the reference equation’s study (age, sex, anthropometric values). Another suggestion is to have baseline measured values of each volunteer as reference values; therefore, if the gain is higher than the test variability after intervention, the test will be considered success.
Conclusion
We conclude that is possible to identify normal values of muscle strength based on some MIP [9, 10, 13] and MEP [14, 15] equations; however, there is significant variability between measured and predicted MIP/MEP values, especially for children.
Acknowledgments
None to declare.
Financial Disclosure
None to declare.
Conflict of Interest
None to declare.
Informed Consent
Subjects were enrolled in the study after the informed consent form had been read, agreed to, and signed by both the subject and legal guardian.
Author Contributions
NM: conception and design of the study, acquisition of data, drafting the article and final approval the version to be submitted. PDL: conception and design of the study, analysis and interpretation of data, revising the article and final approval the version to be submitted. JCS: acquisition of data, revising the article and final approval the version to be submitted. JDS: acquisition of data, revising the article and final approval the version to be submitted. LCGS: acquisition of data, revising the article and final approval the version to be submitted. SDC: conception and design of the study, analysis and interpretation of data, revising the article and final approval the version to be submitted. FCL: conception and design of the study, analysis and interpretation of data, drafting the article and final approval the version to be submitted.
Data Availability
The data supporting the findings of this study are available from the corresponding author upon reasonable request.
| References | ▴Top |
- Marcelino AM, da Cunha DA, da Cunha RA, da Silva HJ. Respiratory muscle strength in asthmatic children. Int Arch Otorhinolaryngol. 2012;16(4):492-496.
doi pubmed pmc - Vendrusculo FM, Heinzmann-Filho JP, Piva TC, Marostica PJ, Donadio MV. Inspiratory muscle strength and endurance in children and adolescents with cystic fibrosis. Respir Care. 2016;61(2):184-191.
doi pubmed - Khirani S, Ramirez A, Aubertin G, Boule M, Chemouny C, Forin V, Fauroux B. Respiratory muscle decline in Duchenne muscular dystrophy. Pediatr Pulmonol. 2014;49(5):473-481.
doi pubmed - Finkel RS, Weiner DJ, Mayer OH, McDonough JM, Panitch HB. Respiratory muscle function in infants with spinal muscular atrophy type I. Pediatr Pulmonol. 2014;49(12):1234-1242.
doi pubmed - Lima EV, Lima WL, Nobre A, dos Santos AM, Brito LM, Costa Mdo R. Inspiratory muscle training and respiratory exercises in children with asthma. J Bras Pneumol. 2008;34(8):552-558.
doi pubmed - American Thoracic Society/European Respiratory Society. ATS/ERS Statement on respiratory muscle testing. Am J Respir Crit Care Med. 2002;166(4):518-624.
doi pubmed - Khemani RG, Sekayan T, Hotz J, Flink RC, Rafferty GF, Iyer N, Newth CJL. Risk factors for pediatric extubation failure: the importance of respiratory muscle strength. Crit Care Med. 2017;45(8):e798-e805.
doi pubmed pmc - Troosters T, Gosselink R, Decramer M. Respiratory muscle assessment. Eur Respir Mon. 2005;31:57-71.
- Lanza FC, de Moraes Santos ML, Selman JP, Silva JC, Marcolin N, Santos J, Oliveira CM, et al. Reference equation for respiratory pressures in pediatric population: a multicenter study. PLoS One. 2015;10(8):e0135662.
doi pubmed pmc - Domenech-Clar R, Lopez-Andreu JA, Compte-Torrero L, De Diego-Damia A, Macian-Gisbert V, Perpina-Tordera M, Roques-Serradilla JM. Maximal static respiratory pressures in children and adolescents. Pediatr Pulmonol. 2003;35(2):126-132.
doi pubmed - Heinzmann-Filho JP, Vasconcellos Vidal PC, Jones MH, Donadio MV. Normal values for respiratory muscle strength in healthy preschoolers and school children. Respir Med. 2012;106(12):1639-1646.
doi pubmed - Tomalak W, Pogorzelski A, Prusak J. Normal values for maximal static inspiratory and expiratory pressures in healthy children. Pediatr Pulmonol. 2002;34(1):42-46.
doi pubmed - Mendes RE, Campos TF, Macedo TM, Borja RO, Parreira VF, Mendonca KM. Prediction equations for maximal respiratory pressures of Brazilian adolescents. Braz J Phys Ther. 2013;17(3):218-226.
doi pubmed - Wilson SH, Cooke NT, Edwards RH, Spiro SG. Predicted normal values for maximal respiratory pressures in caucasian adults and children. Thorax. 1984;39(7):535-538.
doi pubmed pmc - Gaultier C, Zinman R. Maximal static pressures in healthy children. Respir Physiol. 1983;51(1):45-61.
doi pubmed - Smyth RJ, Chapman KR, Rebuck AS. Maximal inspiratory and expiratory pressures in adolescents. Normal values. Chest. 1984;86(4):568-572.
doi pubmed - Hulzebos E, Takken T, Reijneveld EA, Mulder MMG, Bongers BC. Reference values for respiratory muscle strength in children and adolescents. Respiration. 2018;95(4):235-243.
doi pubmed pmc - Rodrigues A, Da Silva ML, Berton DC, Cipriano G, Jr., Pitta F, O'Donnell DE, Neder JA. Maximal inspiratory pressure: does the choice of reference values actually matter? Chest. 2017;152(1):32-39.
doi pubmed - Miller MR, Hankinson J, Brusasco V, Burgos F, Casaburi R, Coates A, Crapo R, et al. Standardisation of spirometry. Eur Respir J. 2005;26(2):319-338.
doi pubmed - Polgar G, Promadhat V. Pulmonary function testing in children: techniques and standards. Philadelphia: Saunders. 1971:273.
- Landis JR, Koch GG. The measurement of observer agreement for categorical data. Biometrics. 1977;33(1):159-174.
pubmed - Bland JM, Altman DG. Statistical methods for assessing agreement between two methods of clinical measurement. Lancet. 1986;1(8476):307-310.
pubmed - Tagami M, Okuno Y, Matsuda T, Kawamura K, Shoji R, Tomita K. Maximal respiratory pressure in healthy Japanese children. J Phys Ther Sci. 2017;29(3):515-518.
doi pubmed pmc - Arnall DA, Nelson AG, Owens B, Cebria i Iranzo MA, Sokell GA, Kanuho V, Interpreter C, et al. Maximal respiratory pressure reference values for Navajo children ages 6-14. Pediatr Pulmonol. 2013;48(8):804-808.
doi pubmed - Johan A, Chan CC, Chia HP, Chan OY, Wang YT. Maximal respiratory pressures in adult Chinese, Malays and Indians. Eur Respir J. 1997;10(12):2825-2828.
doi pubmed - Sachs MC, Enright PL, Hinckley Stukovsky KD, Jiang R, Barr RG, Multi-Ethnic Study of Atherosclerosis Lung Study. Performance of maximum inspiratory pressure tests and maximum inspiratory pressure reference equations for 4 race/ethnic groups. Respir Care. 2009;54(10):1321-1328.
pubmed pmc - Cox DW, Verheggen MM, Stick SM, Hall GL. Characterization of maximal respiratory pressures in healthy children. Respiration. 2012;84(6):485-491.
doi pubmed - Delgado RN, Campos TF, Borja Rde O, de Freitas DA, Chaves GS, de Mendonca KM. Maximal respiratory pressures of healthy children: comparison between obtained and predicted values. Pediatr Phys Ther. 2015;27(1):31-37.
doi pubmed
This article is distributed under the terms of the Creative Commons Attribution Non-Commercial 4.0 International License, which permits unrestricted non-commercial use, distribution, and reproduction in any medium, provided the original work is properly cited.
International Journal of Clinical Pediatrics is published by Elmer Press Inc.